
Easyjet has now released its final results for the year ended 2016.
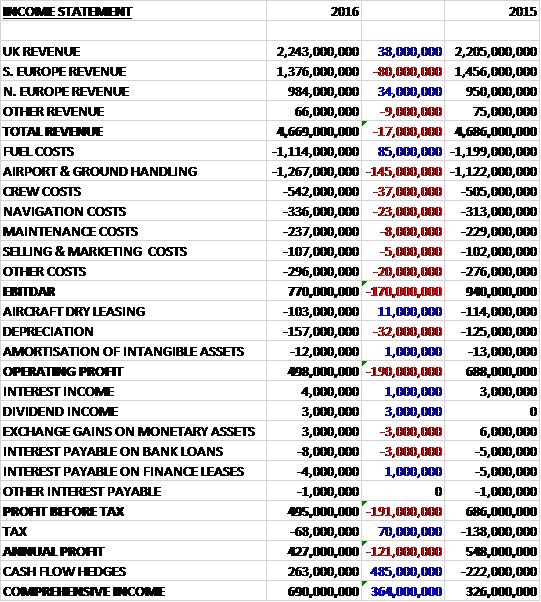
Revenues declined when compared to the prior year as a £38K growth in UK revenue and a £34M increase in Northern Europe revenue was more than offset by an £80M fall in Southern Europe revenue and a £9M decrease in other revenue. Fuel costs were down £85M but airport and ground handling costs grew £145K, crew costs were up £37M, navigation costs increased £23M and other costs were up £33M to give an EBITDAR £170M down on last year. Aircraft dry leasing costs declined by £11M but depreciation was up £32M which meant that the operating profit fell by £190M. Finance costs were broadly flat but tax declined by £70M to give an annual profit of £427M, a decline of £121M year on year.
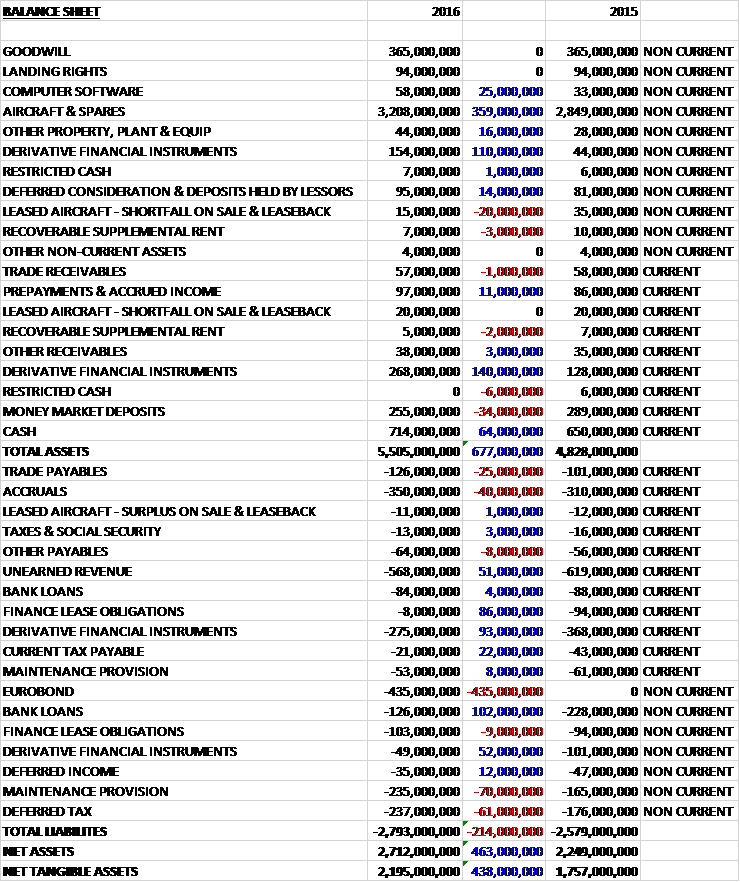
When compared to the end point of last year, total assets increased by £677M driven by a £359M increase in the value of aircraft and spares, a £250M growth in derivative financial assets and a £64M increase in cash, partially offset by a £34M decline in money market deposits and a £20M decline in the value of leased aircraft. Total liabilities also increased during the year as a £435M increase in Eurobonds, a £62M growth in the maintenance provision, a £61M increase in deferred tax liabilities and a £40M growth in accruals were partially offset by a £106M reduction in bank loans, a £145K fall in derivative financial liabilities and an £77M decline in finance lease obligations. The end result was a net tangible asset level of £2.195BN, a growth of £438M year on year.
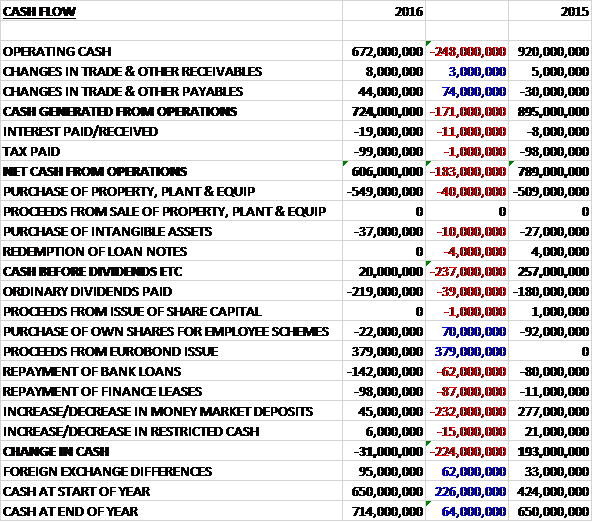
Before movements in working capital, cash profits declined by £248M to £672M. There was a cash inflow from working capital, in particular an increase in payables and after interest payments grew by £11M the net cash from operations came in at £606M, a decline of £183M year on year. The group spent £549M on fixed assets along with £37M on intangibles to leave a free cash flow of just £20M. This didn’t even cover the £22M spent on shares for employee incentive schemes let alone the £219M spent on dividends. The group also repaid some bank loans and finance leases but gained proceeds of £379M from the issue of a Eurobond which meant that there was a cash outflow of £31M for the year and a cash level of £714M at the year-end.
The total European short haul market grew by 6% year on year and by 8% in the group’s markets, driven primarily by a continued low fuel price. The group grew capacity by 7% with a growth of 8% in the first half and 6% in the second half. The group’s competitors grew capacity by 8% with particularly strong growth in Spain and Germany. The group saw passenger numbers increase by 6.6% to 73.1M and load factor saw a 0.1pp increase to 91.6%. Capacity increased by 6.5% with growth focused on strengthening their number one positions at certain airports.
Revenue per seat declined by 6.4% to £58.46 due to increased market capacity and aggressive pricing stimulated by a sustained low fuel price; cooling of demand and reduced consumer confidence following multiple terrorism related incidents; higher holiday costs for UK travellers following the EU referendum and subsequent weakening of Sterling; and severe disruption during the year due to strikes, severe weather and airport issues which resulted in 8,349 flights being cancelled, delayed or diverted (compared to 6,789 last year).
Disruption due to air traffic and other strikes in Europe, as well as severe weather and runway closures at Gatwick, has severely impacted the group’s performance during the year. They cancelled 3,268 flights compared to 2,637 last year and on time performance was 77%, a decrease of 3pp from 2015. To secure better on-time performance they are focusing on reducing the number of events due to technical issues, using predictive maintenance and enhanced parts management; improve disruption management through better processes and communication with customers and influence structural improvements through discussions with airports, governments and the EU.
The total cost per seat improved by 2%, down to £52.26 and on a constant currency basis there was a 4.6% improvement. This reduction was due to lower fuel costs and excluding fuel, cost per seat increased by 2.6% (constant currency 1.1%). Overall there were forex cost headwinds of £112M. Airport and ground handling cost per seat increased by 6.1% and 1.5% at constant currency. Charges at regulated airports increased, primarily in Italy, combined with an increase in airport and ground handling costs at Gatwick which was the main reason for the increase in non-fuel costs.
There are a number of initiatives in place that will help to deliver cost per seat targets. They are now in their third year of a seven year contract at Gatwick. They are the largest operator in the airport and will be consolidating their position into one terminal in 2017 to enhance operational efficiency. They are also the largest operator in Luton where they are in year three of a ten year contract. As they grow their positions in new bases such as Amsterdam and Venice they will benefit from volume-related pricing agreements. In Ground Handling they annualised the benefit of their contract in Italy and saw savings from their growth airports in the UK, Netherlands and Germany. They expect to agree a number of new airport and ground handling contracts this year and next.
In maintenance, the new component support arrangement, which started in October 2015, combined with other parts and heavy maintenance contracts, delivered savings of around £40M during the year. This was supported by better distribution of parts across the network to enable faster repairs to aircraft. They have also begun using predictive analysis with the target to reduce parts failures and improve aircraft reliability.
To control costs of strikes, airport congestion and aircraft unavailability they are investing some of their cost savings to increase resilience in their operations, including more flexibility in the network. They are also implementing improvements to rosters and scheduling to improve fatigue management, better lifestyles for crew as well as increase their ability to recruit future talent. This will deliver passenger benefits and longer term cost improvements.
During the year the group added 106 routes to the network, slightly more than last year. They were focused on bases which supported the consolidation of their leading positions, including the UK, Switzerland and Italy; growing their market share in France; or allocated to new bases such as Amsterdam, Venice and Porto. In February they opened a new base in Barcelona and in April announced a plan to open a seasonal base in Palma Mallorca for summer 2017. They also discontinued 38 routes which did not meet expected return criteria or became secondary to a more attractive route elsewhere.
In the UK they increased capacity by 8%, maintaining market share on the London to Scotland routes while investing in growth in Luton, Bristol and Manchester. Their competitors increased their capacity in these markets by 9%. In Italy the group is the biggest operator at Milan Malpensa with 21 aircraft, recently opened a new base at Venice with four aircraft and added a fourth aircraft to the base in Naples. During the year they closed Rome Fiumicino which still remains an important part of the network. Overall they increased capacity in Italy by 1% against competitor growth of 8%.
The group sees opportunities to grow market share in France, leveraging their competitive market position against Air France, adding capacity at CdG through up-gauging and strengthening their domestic network. They are the number one carrier in Nice and increased capacity by 8% in the country against competitor growth of 5%. The group increased capacity by 7% in Switzerland, building and reinforcing their leading positions at both Geneva and Basel and their strategy is to continue to build consumer preference in the market. Competitor capacity declined by 1% in their markets, impacted by their strong action over the past two years.
They are targeting continued growth in Germany, taking share from the incumbent operators. They have increased capacity by 5% but competitor growth was 11%, with high growth at Berlin Schonefeld in particular. In the Netherlands, having opened a new base at Schiphol airport in 2015, they are now the second biggest operator and are continuing to invest in growth of their market share. They increased capacity by 24% against competitor growth of 8%. They increased capacity by 17% and 6% in Portugal and Spain respectively. They opened their new base at Barcelona in February with competitor growth 14% in Portugal and 16% in Spain.
The group expects to incur a number of non-underlying costs in 2017. As a result of the UK’s vote to leave the EU the group plans to establish an Air Operator Certificate in another EU member state. This will secure the flying rights of the 30% of their network that remains wholly within and between EU states. This one-off cost is expected to be around £10M over two years with the primary driver of the cost being the re-registering of aircraft in an EU jurisdiction.
They are planning to enter into a sale and leaseback arrangement for ten aircraft which is expected to take place in December 2016. Due to the age of the selected aircraft and the time of this transaction and maintenance provision accounting, they expect to incur a one-off non-cash charge of about £20M. I am really not a fan of the short-term sale and leaseback deals – I don’t think they worked well for the supermarket and I don’t think they work well here either. There will also be expenses associated with the implementation of the organisational review in 2017.
The group have continued to target business passengers, growing the number of passengers by 6% to 12.5M. They also signed 137 corporate agreements over the year, representing a 25% increase against the prior year. There has also been a growth in business specific fares throughout the year with a 14% increase in Flexi fares which carry a greater yield premium.
Non-fare revenue increased by 17% in the year. Some recent innovations have been a mobile-app only proposition, targeting customers who may wish to switch flights at short notice on the day of travel. This flexibility is offered for £15. Also investment continues to pay off on in-flight revenue with growth of over 30%. This year saw the introduction of pre-purchased in-flight vouchers, scaled through a targeted CRM programme.
The group continues to hedge its fuel requirement. In the first half of 2017, 83% of requirements are hedged at $664 per tonne; for the full year 81% is hedged at $617 per tonne and in 2018 47% is hedged at $510 per tonne. A $10 movement in fuel price impacts the fuel bill by $2.8M and a 1c movement in £/$ impacts the 2017 profit by £2M as the fuel is purchased in dollars. During the year the average market fuel price fell by 33% to $415 per tonne so considerably lower than the hedged price.
The group is contractually committed to the acquisition of 166 Airbus A320 aircraft with a total list price of $14.8BN before escalations and discounts. Some 21 aircraft will be delivered in 2017, 15 in 2018 and 130 in the subsequent years to 2022. Capex in 2017 is expected to be £650M but this increases to £1.1BN in 2018 with a similar figure expected for 2019.
The group raised a €500M bond in February for a seven year term with a fixed annual coupon rate of 1.75%, and after the year-end in October they issued a further €500M bond on improved terms.
In the first half of 2017, capacity is expected to increase by 9% with a similar increase expected for the full year. Based on the current market fuel prices they expected the unit fuel bill to decline by between £245M and £275M in 2017. Passengers will continue to benefit from the lower fuel cost and they therefore expect a mid to high single digit decline in revenue per seat at constant currency in the first half.
They are targeting a decline in total cost per seat at constant currency of about 3% based on jet fuel prices within a range of $400 per tonne to $520 per tonne. Cost per seat excluding fuel at constant currency is targeted to increase by about 1% for the full year at normal levels of disruption. Exchange rate movements are likely to have an adverse impact of about £70M during the first half of 2017 and £90M for the full year. Market demand is expected to remain strong.
At the current share price the shares are trading on a PE ratio of 8.7 but this increases to 13.5 on this year’s consensus forecast. After a 2.5% reduction in the annual dividend the shares are yielding 5.7% but this is expected to fall further to 4% on this year’s forecast. At the year-end the group had a net cash position of £213M compared to £435M at the same point of last year.
On the 24th January the group released a trading update covering Q1 where trading was in line with expectations. The number of passengers carried increased by 8.2% driven by a growth in capacity of 8.6% and a load factor decreasing by 0.3pp to 90%. Total revenue in the quarter increased by 7.2% to £997M reflecting the increase in passengers carried through the period but revenue per seat decreased by 8.2% at constant currency or 1.2% on a reported basis to £51.64 per seat. Non-seat revenue continued to rise, up 19%, driven by improvements to the inflight product ranges and attractive partner agreements.
Headline cost per seat improved by 2.1% at constant currency due to low fuel prices and an ongoing focus on underlying cost control. Excluding fuel, the headline cost per seat increased by 1.1%. The group delivered £14M of lean cost savings in the quarter through engineering and maintenance, volume-related airport savings and the benefit of ongoing fleet up-gauging. This offset general inflationary cost pressure as well as additional disruption cost mainly due to increasing EU 261 claim rates.
During the period the group issued another €500M bond at 1.125% coupon which seems pretty cheap. Cash deposits therefore increased to £1.337BN but net cash was £217M, down from the £266M recorded last time.
During the quarter the group achieved an on time performance of just 79% compared to 82% in Q1 last year, due to severe weather conditions in December when on time performance was just 73%.
The group entered into a sale and leaseback arrangement for ten A319 aircraft in early December which generated $144M in cash but incurred a non-cash charge of £16M. They have begun to implement the initial findings of the organisational review which has the objective of making their structure more efficient. Costs incurred to date have been immaterial but they continue to target a six to nine month payback period on any costs incurred.
The weakness of sterling and the impact of fuel combined are £35M worse than previously expected. It is estimated that at current exchange rates and with jet fuel remaining within the $520 to $600 per tonne range, the fuel bill for H1 is likely to decrease by between £70M and £80M. On a full year basis it is estimated that the fuel bill will decrease by between £215M and £240M. In addition, exchange rates movements are likely to have around a £75M adverse impact in the first half and £105M for the year as a whole.
The pricing and operating environment remains tough with fuel prices remaining low and continued strong growth in European short haul capacity. About 56% of expected bookings for Q2 have been secured, slightly ahead of the previous year. Revenue per seat in the first half is expected to decline by high single digits which reflects Easter moving into the second half of the year and some impact from the Berlin attack. Adjusting for these items, the year on year revenue per seat decline is expected to improve in Q2 compared to Q1. April is progressing well with the benefit of Easter.
Headline cost per seat excluding fuel is expected to increase by about 1% but the weakness of sterling is expected to impact pre-tax profit by around £105M in 2017.
Overall then this has been a rather challenging period for the group. Although net assets did improve, profits were down along with operating cash flow with no free cash being generated after employee share schemes were taken into account. We have a number of problems, the main one being the fact that revenue per seat is declining at a faster rate than costs, presumably partly due to the increased capacity from competitors who have not hedged their fuel requirements as much as Easy Jet.
These issues are compounded by Brexit, with the duel effect of adverse forex movements and the need to register some aircraft in EU jurisdictions which will add extra costs. Additionally there seems to be a high level of disruption at the moment with strikes and bad weather. The group is also embarking on a high level of capex, all of which makes for a rather risky time for the group. I don’t think this is fully covered by the forward PE of 13.5 and yield of 4% so I remain on the side lines for now.
On the 6th February the group released their passenger stats. Overall the total increased by 11% and the load factor grew by 1.2pp to 86.2%.
On the 6th March the group released its passenger stats for February. Overall passengers were up 8.2% and the load factor increased by 1.6pp to 92%.
On the 6th April the group released their passenger stats for March. The load factor increased by 1.4pp to 92.7% which is above average and looks fairly decent.
On the 5th May the group announced their passenger stats for April. The load factor increased by 2.5pp year on year to 92.9M and the total number of passengers grew by nearly 12%.