Dechra Pharmaceuticals PLC – Interim Report 2012

Dechra have released their half year results for the first half of 2012 so without further ado I will go straight into the income report.

So, if we look at the profit for the half year, it is very similar to that of the first half of last year.  Revenues are up across all business units but cost of sales are also up nearly £13M to leave a gross profit £4.4M higher from last year at £46.5M.  This is not bad but I would have hoped to have seen more of an increase from the acquired businesses.  Distribution costs remain steady but the non-cash amortisation of intangibles charge is up £1.3M to £5.2M.  Admin expenses are up too which leaves the overall operating profit up £1M to £11M.

Although revenues are up in the service sector, there has been some pressure on margins due to increased discounting in a competitive market and the actual profit contributed by the services segment is down about £1M to £5.4M.  The profit contribution from the European and US pharmaceutical arms has increased.  In the case of the European business it is up £2.4M to £12.8M and for the US it is up £400K to £2.3M.

Looking at the non operating items, it can be seen that the foreign exchange income has swung to negative, and along with lower finance income and a few other items, the profit before tax is slightly down on last year at just under £9M.

When considering the total income we can see that it has taken a dive of £6M, mainly sure to a similar swing on the foreign currency translations on foreign operations, suggesting there has been an unfavourable shift in exchange rates.

From the financial position sheet we see that, although net assets are down slightly at £96.5M, the net tangible assets have recovered somewhat on the position at the end of last year, being £6.5M up at -£20.3M.  This I believe is a step in the right direction.  When looking the assets themselves, they seem to be down almost uniformly.  The massive intangible asset base is £8.3M down while cash has plummeted £15.4M to £15.1M.  This does seem to be somewhat seasonal, however, as last year there was a similar dip before the second half brought in more cash so I am not too concerned about this.  Inventories were the only asset type to increase – up £7.6M to £48.4M.

Looking at liabilities, we see that these have come down too.  The largest reduction is in trade and other payables so hopefully Dechra have been receiving payments quicker (rather than suffering reduced orders).  Other points of interest are the slight reduction in borrowings and a small reduction in the tax liability.

So, given there were no large acquisitions in this half it was a much quieter period with regards to cash flow.  However, we can see there was a fairly disappointing cash outflow of £15.4M.  The operating cash flow is hit by £8.3M more being tied up I inventories and an £8.7M decrease in payable suggesting that Dechra is paying up quicker or the payment cycle perhaps means they pay for more items in the first half of the year. The £3.8M in tax paid seems to be quite a bit higher than it was in the same period last year which didn’t help the cash flow situation.

Although there were no new acquisitions, we see that £500K was paid out in “acquisition of subsidiaries” This was a contingent consideration on the purchase of Genitirx due to it hitting a performance target.  The other items of interest ate a £4.3M repayment in borrowings which is required by the bank and a hike of £820K in dividend payments to £5.6M.  Hopefully this means the group are confident of an increased cash flow in the second half as with only £15.1M of cash left, another half like this would wipe out the cash level completely.  The second half is traditionally much more cash generative, however so I don’t think much can be taken from this outflow in the first half of the year.

After this reporting date, Dechra acquired the non-Canadian world rights of HY-50 for £5.1M.  This was funded using the dwindling cash reserves.  It is a treatment for horse lameness and is expected to be earnings enhancing in the first full year of ownership.  Dechra are certainly on an expansion phase at the moment…


In Europe, demand for pharmaceutical products has been strong and growth has also occurred due to the manufacture of Vetoryl and the launch of Dermapet products into the Nordic countries.  Pet Diet sales were flat during the half year due to reduced export sales being offset by an increase in sales in core markets. In the US, the growth has been driven by the Dermapet products which are now all converted to the Dechra livery.

As far as the services sector is concerned, revenues were up 7.3% on the same period last year which is partly down to market recovery and partly due to the favourable comparison with the weather affected end of calendar year 2011. Margins, however have suffered somewhat due to an increase in discounting in a competitive market.  Dechra have set up a new IT system and some other services to improve operating margin going forward and it should also improve the purchasing process to improve the inventory level.

Dechra seems to have quite a robust pipeline with a product for canine epilepsy being launched in the second half of this year and two new therapeutic pet diets having been developed.

Overall then, these are solid if not amazing results.  The profit is similar to the same period of last year with increases in the pharmaceutical profits dragged down by the margin erosion for the service business.  The group seems to have adversely affected by the exchange rates too.  Net tangibles are up slightly, which is quite pleasing but the large cash outflow is a little disappointing, albeit rather seasonal so the actual cash flow will only become apparent by looking at the full year results.  The group also seem to be taking action with regards to the stock tied up in inventories.  The board have increased the interim dividend to make the total dividend yield 2.5% which is decent but not stellar.  I will continue to hold.

On 5th April 2012, Dechra announced its intention to buy Eurovet Animal Health, an animal pharmaceutical company based in the Netherlands.  The group seem to be quite similar to Dechra and the price they expect to pay is £112.5M.  This is larger than the Dermapet acquisition is really a rather large undertaking.  This is expected to be funded by a rights issue to raise £60M and new debt facilities to raise the rest of the cash.  The new shares are being offered at a heavy discount and I suspect I will take up the offer but the extra debt worries me slightly.  I do hope this spells the end of the current spate of acquisitions and that after this purchase, Dechra concentrate on integrating the new businesses and focus on organic growth.  I have been burnt before by companies I own shares in over stretching themselves and I really hope this isn’t happening here.


Dechra Pharmaceuticals PLC FY 2011

Dechra House, Jamage Industrial Estate, Talke Pits, Stoke on Trent, ST7 1XW

Next up for my shares blog is Dechra Pharmaceuticals.  Dechra is an international pharmaceutical business focussed on the veterinary market with its key area of specialisation being the development and marketing of companion animal products and their business is split into several segments:

Product Development

This segment deals with the ongoing development of their specialist branded vet products and the group has a programme to increase its current product portfolio.  They are looking to develop prescription only vet medicines targeted towards dogs, cats and horses.  These products generally utilise technology already existing in the human market. Dechra are also developing pet diets for cats and dogs that have been diagnosed with various medical conditions and unlicensed medicines such as shampoos and supplements for dogs, cats and horses.

European Pharmaceuticals

This segment comprises Dechra Vet Products Europe and Dales Pharmaceuticals

US Pharmaceuticals

This segment comprises of Dechra Vet Products US

Services

This segment comprises of National Vet Services,  Nationwide Labs and Cambridge Specialist Lab Services.


They operate in the following areas:

Dermatology

Canaural is sold in the EU and is a treatment for otis externa in cats and dogs; Fuciderm is sold in 23 countries and is a treatment for dermatitis and intertrigo in dogs; Malaseb is a shampoo for treating skin complaints in cats and dogs caused by Malassezia and Staphylococcal infections; Animax is sold in the US to treat skin conditions in cats and dogs and Dermapet treats various skin conditions in cats and dogs.

Endocrinology

Endocrine disorders is apparently a key focus for the group and they have Vetoryl which treats Cushing’s Syndrome in dogs internationally and Felimazole which treats feline hyperthyroidism in various international territories

Equine Medicine

Equipalazone is an anti inflammatory drug for the treatment of musculoskeletal disorders and Equidone is for the treatment of fescue toxicity in horses and is marketed in the US.

Ophthalmology

Fucithalmic Vet treats conjunctivitis and is sold in 21 countries.  There are also 6 products marketed in the US.

Critical Care

There are a number of products that support emergency medicine, which are predominantly sold in the UK

Others

Dechra also manufactures and sells Pet diets, over the counter vet care products, generics and some marketing agreements to sell products through global subsidiaries.

DVP EU

This is the business unit that sells and markets Dechra’s own branded vet products within 13 European countries and manages the relationships with their worldwide marketing structure.  Their products are mainly sold to vet surgeons working out of commercial vet practices.

Dales

Dales is the manufacturing arm of Dechra and manufactures the vast majority of their own brand products.  It also makes money manufacturing pharmaceuticals for third parties, mostly in the human pharmaceutical sector.  Most of the manufacturing is done in the UK but there is a small plant in Denmark too.

DVP US

DVP US sells and markets Dechra’s own branded products in the US.  Their market is small animal and equine vet surgeons operating out of commercial vet practices.

NVS

NVS supplies and distributes vet products to vet practices around the country and is basically the distribution arm of Dechra.  They also develop pharmaceutical stock management IT systems for vet practices.

Labs

NWL provides a first referral lab services to the vet industry covering various areas.  CSLS provides a secondary referral service within the area of endocrinology.  The customers for the lab services are UK commercial vet practices (both companion and large animal).
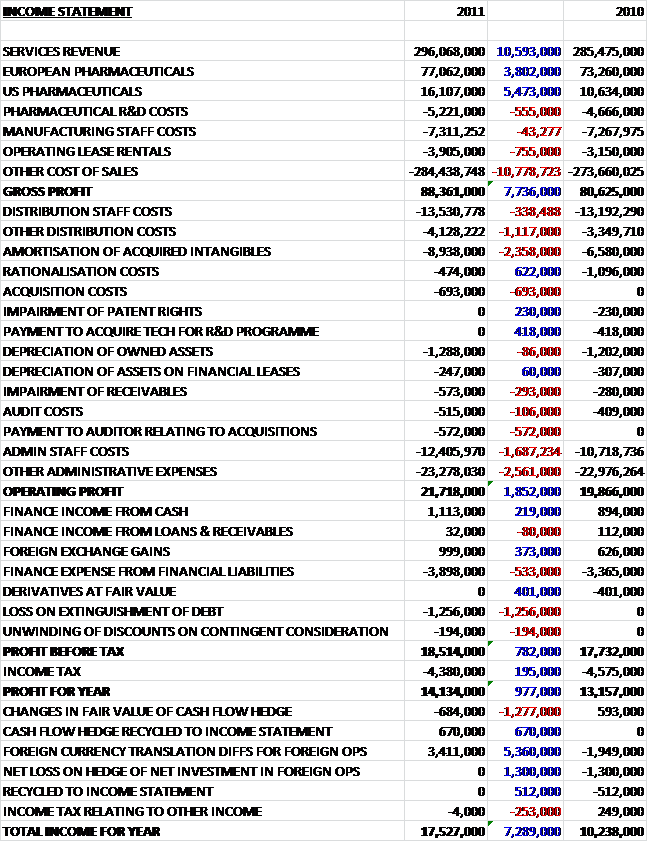
This looks fairly solid. The profit for the year is up nearly £1M to £14.1M and apparently the underlying profit margin is up from 7.6% to 8.2% due to the increase in the pharmaceutical business.  We can see that revenue is up across all sectors (nearly £20M in total).  I am not sure how much of this is due to the acquisitions but I would assume a lot of the £5.5M increase in the US is due to Dermapet (with a small increase due to the increased contribution of Vetoryl).  The cost of sales and admin expenses are also up, however (£11.6M and £3M respectively) and there is a £1.7M increase in staff costs mainly due to investment in the US business, which will presumably increase more next year when the full year of the acquisitions is taken into account.  There were acquisition costs of nearly £700K and although quite low, the impairment of receivables pretty much doubles to £600K so this is something I hope management are keeping an eye on.

Profit in the European pharmaceuticals business rose by 5.1% in the year, mainly due to the increase in the performance of the own branded products.  Sales in diets are up 8% but diet margins are down somewhat due to an increase in raw material costs.  In the services sector, IVS (the distribution arm) showed an increase in profit while the lab business showing a reduction in revenue but they have developed a new product for vet practices to easily test blood samples which it is hoped, will increase sales. Dales, the manufacturing arm was up slightly with a planned reduction in the manufacturing for their largest client offset by bringing more pharmaceutical product manufacturing in-house.

Otherwise we see the amortisation of acquired intangibles, which are up £2.4M to nearly £9M.  This is quite a large charge in my opinion and may suggest an overpayment of previous acquisitions.  It should be noted that this is not a cash charge, however.  Rationalisation costs in 2011 related to the integration of the Dermapet and Gentrix, while the larger costs seen in 2010 relate to the closure of the Shewsbury warehouse and transfer of pre wholesale logistics to Denmark.  The impairment of product rights noted in 2010 relate to the abandoning of an equine development product due to disappointing clinical trials.  Distribution costs are up £1.5M to £17.7M which is mainly due to rising fuel costs and increased volumes.

The total income for the year is up substantially, mainly due to a favourable exchange rate relating to foreign operations.


EPS and P/E Ratio

I am now going to have a look at the EPS and the corresponding P/E Ratio.

EPS

2011

2010

PROFIT AFTER TAX

14,134,000

977,000

13,157,000

NUMBER OF SHARES

66,474,490

336,590

66,137,900

EPS

21.3

19.9

SP

490

385

P/E

23.0

19.4


Taking today’s share price, the P/E is 23.2, which is rather expensive but various analysts expect the EPS next year to be about 38.07, leaving the forward P/E at 12.9, which is much better value – these figures are based on the new business integrating well and giving some decent profit so if these analysts are to be believed, these shares are looking rather cheap when compared to the historic values but if this increase in profit doesn’t materialize, the opposite is true and the shares are a little dear.

Now to look at the Balance Sheet
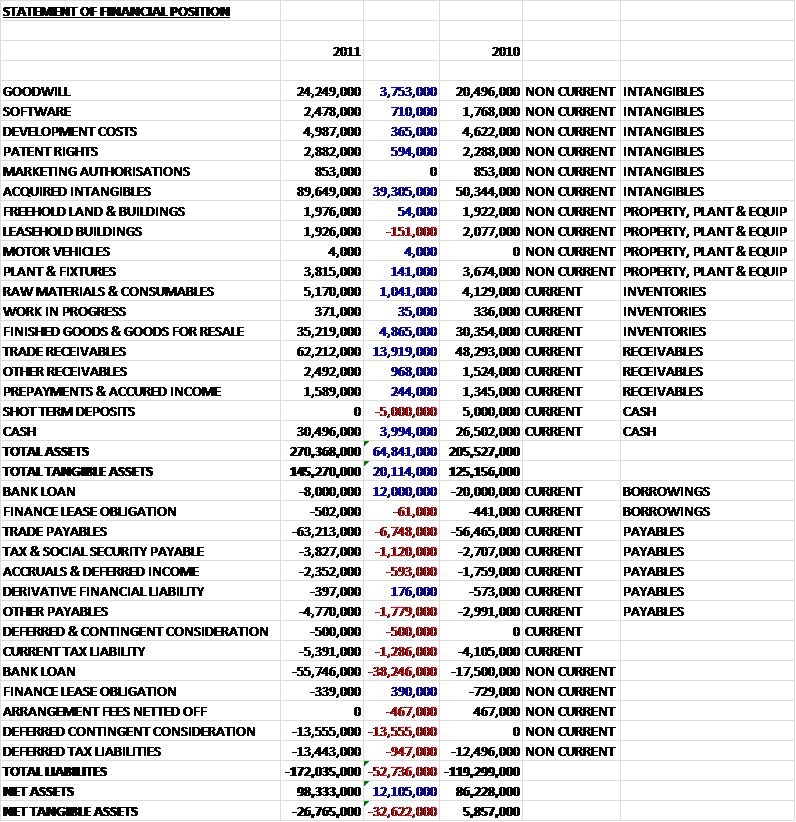
A bit of a mixed bag here.  Obviously these figures are largely going to be affected by the acquisition of Dermapet but let’s see what the situation is.  The net asset level of £98.3M has increased by £12.1M on the level of last year but a glance at the net tangible assets sees a £32.6M decline to leave a negative value of £26.8M.  This in itself is not a terrible thing but I must say it makes me a bit nervous and would rather see a bit of a beefier asset list.  Looking at these intangible assets we see that Goodwill has increased to £24.2M.  I have noted before that I am not really a big fan of large amounts of Goodwill as it is by nature rather subjective and when it comes down to it is not really worth anything but the figure seen here is not that excessive.  The really big number is the Acquired Intangibles.  This has jumped £39.3M to £89.6M and this really gives a gloss to the net asset numbers that also makes me a bit uneasy.  This leap is related to the acquisition and is for the product rights purchased along with the companies.

Moving on to tangible assets, the tangible assets are up just over £20M to £154.3M, within this figure the inventories are up nearly £6M, which were due to ensuring continuity of supply during the transfer of our diet range to a new manufacturer, higher revenues and additional payment terms offered to a major NVS customer. Trade receivables are up nearly £14M to £62.2M.  This could be good or bad depending on whether it is caused by larger orders or slower payment from customers.  Given the new payment terms mentioned above and the increase in revenues, I suspect it is a bit of both.  Cash levels are up slightly to £30.5M but this increase is wiped out when the £5M reduction in short term deposits are taken into account.

On the flip side of the steady cash level we see that loans are up.  Short term current loans are actually down £12M to £8M but the longer term loans are up over £38M to £55.7M.  These loans were mainly used to fund the acquisition of Dermapet and given the low levels of tangible assets, it would be my preference to target a reduction in these loans.  Trade payables are up £6.7M to £62.2, which is less than the increase in trade receivables and the tax liabilities seem rather high – current tax liabilities are £5.4M and deferred tax liabilities are £13.4M.  I am not sure why they are quite so high, I would have thought the R&D work that Dechra do would contribute to a lower taxation amount.  I think there are several countries where tax is paid, however, and the acquisition of Gentrix also acquired over £1M in tax liabilities.

The last item of note, I think is the deferred contingent consideration of £13.6M.  This is clearly due to the recent acquisitions and I am not sure the time frames that it needs to be paid off but it shouldn’t break the bank.  This all leaves total liabilities to be £172M, as noted earlier this is higher than the total tangible assets.

Cash flow:
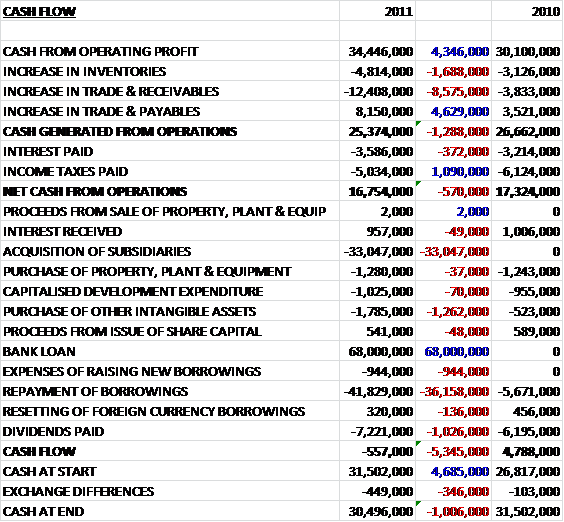
So, the headline figures show a slightly negative cash flow of -£600K, which is a reduction on the last year of £5.4M but there has been such a skewing of the figures from the new loans and acquisitions that it is not that helpful to compare the total figure.

There was £33M paid in cash for the acquisition, which was backed up by new bank loans to the tune of £68M (plus about £1M in costs to arrange the new borrowing).  This in turn, is somewhat negated by the repayment of £41.8M of loans.  So, a quick sum up shows that were it not for the acquisition, the company would have a positive cash flow.  In fact, during the second half of the year, after the acquisition there was a net cash inflow of £15.5M, which is encouraging.

Looking into the operational cash flow, we see that inventories increased by £4.8M and trade and receivables increased by £12.4M while trade payables increased by only £8.2M (at the end of the year the group had an average of 60 days outstanding on purchases compared to 71 days the previous year) so there is more cash tied up in inventory and later payments from customers (and larger orders).  Indeed, the amount of receivables overdue were £7.7M in 2011 compared to £4.2M in 2010 so this is something that I hope the group will keep an eye on.

So, this negative cash flow is not all that alarming given the large acquisition so it will be interesting to see how it fares in the next set of updates.

I think that the next couple of years will be dominated by the acquisition of Dermapet, and to a lesser extent , Gentrix so I have listed the details below.

ACQUISITIONS
DERMAPET INC

01/10/2010

FAIR VALUE TO GROUP
INTANGIBLE ASSETS

38,909,000

INVENTORY

384,000

TRADE & OTHER RECEIVABLES

1,084,000

PAYABLES

-217,000

GOODWILL

326,000

NET ASSETS

40,486,000

SATISFIED BY:
CASH

27,519,000

DEFERRED CONSIDERATION

1,163,000

CONTINGENT CONSIDERATION ARRANGEMENT

11,804,000

TOTAL

40,486,000

DERMATOLOGICAL PRODS FOR PETS
GENTRIX LTD

01/12/2010

FAIR VALUE TO GROUP
INTANGIBLE ASSETS

184,000

PROPERTY, PLANT & EQUIPMENT

23,000

TRADE & OTHER RECEIVABLES

326,000

INVENTORY

217,000

CASH

59,000

IDENTIFIABLE INTANGIBLE ASSETS

5,596,000

PAYABLES

-318,000

DEFERRED TAX LIABILITIES

-1,546,000

GOODWILL

1,845,000

NET ASSETS

6,386,000

SATISFIED BY:
CASH

5,586,000

CONTINGENT CONSIDERATION ARRANGEMENT

800,000

TOTAL

6,386,000


From this we can see exactly what Dechra paid for their acquisitions.  As touched on earlier in this report, I think the intangibles here are rather high and there are not many tangible assets acquired with these companies.  Indeed Gentrix comes with a deferred tax liability of over £1.5M.  The other point of interest, I believe, is the contingent consideration.  Dechra may be obliged to pay out over £12.5M more on these acquisitions.  For Dermapet, these obligations are payments of US$1M due on the 2nd and 4th anniversaries of the completion date; US$15M payable between the 2nd and 6th anniversary or completion if Dermapet achieves in excess of $15M in any rolling 12 month period, and a further US$5 will become due if revenues exceed $20.  This ties Dechra into payments for a considerable potential period.  For Gentrix, the potential payments are more modest – £0.8M is payable on the achievement of specific milestones (not sure what they are).

Dermapet was a Florida based dermatological business and was purchased mainly to strengthen Dechra’s position in the US, which is the largest market for companion animal products.  Genitrix was a privately owned company that operated solely in the UK and the intention here was top extend the Genitrix product range in to other EU territories.  The Goodwill under the Dermapet acquisition relates to workforce and increased geographical presence in the US.  The Genitrix goodwill relates to the workforce and associated technical expertise.

During the year, Dermapet was fully integrated and contributed nearly £2M to the operating profit of the group while Genitrix contributes quite a respectable £740K to profits during the year which given the total consideration paid for Genitrix and the fact that it was only contributed for part of the year is a very good return on investment.


This is not the first time the group has made a large acquisition, and it can be said that the last one has integrated well and helped Dechra grow in the way it has in previous years.  However, I do have a note of caution.  These acquisitions have pushed the net tangible assets into negative territory and there is clearly an increase in net debt to pay for them.  Also, foreign (and in particular UK) companies tend to struggle in the US as there seems to be quite a protectionist attitude.  BP, National Grid and Glaxo being high profile casualties, having run into problems in the world’s largest economy in recent years.

I think it is a case of wait and see how this goes.

Parts of the business have been affected by a decline in footfall through vet practices which has been offset in the UK by strong growth in the livestock sector and increase in vet products being purchased online.  Dechra have various products being developed which should come online in the next few years that they predict will generate an extra £30M or so annually eventually.  The group seem to be on a strategy to sell more of their products through subsidiaries.  Despite the initial costs, this will enable Dechra to increase margins in these products.

The group is still very dependent on the UK but with the US acquisition and increasing sales in other parts for the world, this is slowly starting to change.  No customer accounted for more than 10% of group revenues but there was one client who accounted for 13.1% of gross trade receivables.  Despite the large loan, the payment terms seem fairly sensible and the bulk of the loan is payable in 2-5 years.  A 2% increase in interest rates would reduce profit by £281K, which isn’t that much but in the medium term it may cause an issue should interest rates rise substantially.  Dechra do seem to be quite susceptible to exchange rate changes, a 10% appreciation of GBP compared to Danish Krone would incur a £2.2M reduction in profit, a similar movement against USD would reduce profits by £2.5M and the same movement against the Euro would cause a £720K reduction in profit.  While the former two movements are rather unlikely in my opinion, the latter is certainly possible and the figures quoted here are quite substantial.

One other point of interest is that Danish authorities are investigating the tax return of the Danish arm of Dechra relating to a period before it was acquired (it was acquired as VetXX Holding A/S) in order to claw back some tax they think they are owed.  Dechra are disputing the claim but should the Danish authorities be successful, it could cost £1.3M.


Overall then, these are a mixed bag of results, which are completely dominated by the acquisition of Dermapet.  The profit is up slightly to just over £14M and the revenues are up across the board.  The cash flow is slightly negative and the net tangible assets are a slightly concerning negative £26.8M.

The current P/E of 23.2 is rather expensive but the group is expected to increase the EPS next year to give a P/E of 12.9 which, if this comes to pass is a fair valuation.   The net debt increased by £26.9M but again, this is due to the acquisition.  Dechra have made large acquisitions before and seem to have integrated them well.  The group has also increased the underlying profit each year over the last five years.   Finally the current dividend yield of 2.5% is OK, but nothing stellar.  It is, however, fairly well covered at 2.6 times. This is a tricky share to know what to do with.  I am in a slight profit overall and part of me thinks it may be worth selling the shares to take profits given the uncertainty over the acquisition, however my holding isn’t very large and I have a bit of a problem bringing myself to sell shares so I suspect I will end up Holding.

Profit                                                     £14.1M

Net Debt                                             £34M

Change in Net Cash (Debt)          -£26.9M

Net Tangible Assets                        -£26.8M

Current P/E                                        23.1

Dividend Yield                                   2.5%


On 4th November 2011, the group gave an interim statement for trading in the first quarter of the year ending 2012.  Overall the group was performing quite well with revenues in the European sector up 5.2% overall with a 10.3% increase at constant currency levels in pharmaceutical products offset by flat revenues in diet products.  US pharmaceuticals were up 70%, predominantly due to the contribution from Dermapet and the services sector was up 5.4% on the first quarter of the year before.  Margins have reduced in the service area, however.  Not really much to go on but all seems OK with this, still a hold for me.

On 29th November 2011, the group announced that they had gained approval to manufacture Vetoryl in the US.  This can only be a good thing, allowing Dechra to manufacture more of their own products in a market they are aggressively targeting.

On 11th January 12, Dechra released a statement relating to the trading in the first half of the year.  Overall revenues were up 9.1%.  In the European pharmaceuticals sector the total revenue was up 7.8% with the core pharmaceuticals up 13.8% and the diets flat – this was caused by an increase in sales to core markets offset by a reduction in exports.  US pharmaceutical revenues were up 44.6% when compared to the same period of the year before where Dermatpet and Vetoryl grew earnings but there were still supply issues experienced from some of the suppliers.  The services sector grew revenue by 7.4% but margins in this area were hit due to the current competitive nature.  Overall a fairly decent update – I continue to hold.

James Halstead PLC F/Y 2011

Beechfield, Hollinhurst Road, Radcliffe, Manchester, M29 1JN


James Halstead, so far, has been a good success story for me.  The value of my initial investment is higher here than for any other share I have in my portfolio.  I therefore know they must be doing something right!

James Halstead provides flooring for a huge variety of industries from shop floors to large ships.  Their businesses are separated as follows:

Polyflor – This is the UK arm of the business and provides flooring for various industries

Polyflor Nordic – This is based in Sweden and Norway and provides flooring in these regions.  Over the year, they have experienced considerable growth in shop flooring with new installations in Team Sportia, Em Bobler and Lidkoping hospital.

Polyflor Pacific – This part of the business mainly covers Australia and New Zealand and offer an number of different types of flooring in these regions.  Over the year they have received orders from Liverpool Hospital and have benefited from an Australian government initiative to invest in schools.

Objectflor – This is the European arm of the business, providing flooring to these regions. Over the year projects have included the new ADAC HQ in Munich and the Rolex HQ in Geneva.

Phoenix Distribution –This business is somewhat different to the others in that it does not involve flooring.  Phoenix Distribution distributes motorcycle accessories such as helmets in the UK.  They have had a difficult year and one competitor has exited the market.  The business does remain profitable, however.

Starting off with the income statement.

Overall, this set of results look fairly good.  The profit for the year is £1.7M up on last year, at £27.5M.  The total income is up by a lot more due to the combined effects of a positive swing in the acturial valuation of the pension scheme and a positive foreign currency translation difference.

Revenue is up across the board, with particularly large increases in Germany, France, Scandinavia and Australia.  Cost of sales is also up, but to a lesser degree.  There are not really any other large changes in costs to speak of but the fees paid to the auditing company seem rather high.  There is also a rather hefty tax bill, at £11M.

EPS & P/E Ratio

                                                        2011                                               2010

PROFIT AFTER TAX

27,465,000

1,786,000

25,679,000

NUMBER OF SHARES

104,347,570

741,000

103,606,570

EPS

26.3

24.8

SP

485.9

167

318.8

P/E

18.5

6

12.9


Taking today’s share price, the current P/E is 18.4, which is higher than all my other investments so far – a sign that this is a bit of a safe haven.  Future EPS is estimated at 28.95, leaving the future P/E at 16.8 – this is a little cheaper but still a little pricey.

Moving on to the balance sheet:

The headline figures here point to a very healthy balance sheet.  The net tangible assets of £82.4M are up nearly £19M on last year, and for a company with only £200K or borrowing, this really is a good safety net.  The largest increase in assets we see is a large jump in inventories, which suggest a ramping up of production.  We also see that buildings and equipment are up over £7M.

Looking at the liabilities, there is a fairly large increase in trade payables which I would expect considering the increase in inventory.  On the other hand, we see that the pension liability has improved somewhat, leaving a still rather substantial total of over £12M. The final salary pension scheme has been closed to employees now for quite some time.

Shareholder Makeup.

There are only 2 shareholders who own more than 3% of James Halstead.  By far the largest is John Halstead, at 17.4% of the Halstead family Rulehate Nominees with 7.1% – not sure who is represented by them.  I do like to see the family of the founders still invested in a company (and in this case, still running the company).

Moving on to cash flow:

Again, this is a fairly solid set of results, but if I was being mega critical perhaps the first sign of something to keep an eye on.  The cash reserves are very good considering the lack of debt, but they only increased by £667K over the last year, when compared to an increase of £5.8M the year before (and that included a hefty special dividend).  So, what has happened to the cash?

Although more was made from the profit, we see that over £10M is tied up in the increase in inventories.  This is due to the higher value of stock from the increase in raw material costs and the increase in large infrastructure products that require a lot of stock.  Trade and receivables are also up, albeit by less than last year, and this was due to an increase in exports and the related longer payment terms for these customers. We can also see £1.7M more being paid to the tax man and a large increase in capital expenditure, with £5.7M more being spent on property, plant and equipment.  This is partly due to the opening of the Teesside manufacturing plant.

So, this isn’t a bad cash flow by any means, but I do think the spend on inventories needs to be kept in mind.


Overall then, as expected, this is a very solid set of results.  Profit is up, there is no debt, a large cash pile and tangible assets are up a large amount.  Cash flow is under a small amount of pressure but, otherwise nothing to complain about at all.

There have been a number of difficulties this year.  The trading conditions in the UK have been difficult, the raw material costs have been increasing and the start up of the Teesside manufacturing plant has incurred costs but against this, James Halstead has seen large increases in revenue for other parts of the world, in particular Australia (28% increase), Germany (25% increase), France (19% increase) and Scandinavia (17% increase) and some notable new installations have included the Nurburgring event centre, the Niagara Falls convention centre in Canada; the Kokura Railway station in Japan; the Wuxi Grand theatre in China; the Indian naval ship Vikramaditya and the Australian Gorgan gas project.  This really underlines the diversity of projects that James Halstead has been involved in.

In conclusion, the attraction of this company is clear.  It makes increasing profits every year, revenue is up across the board, there is a very healthy increase in net tangible assets and there is no debt.  So are there any downsides?  Well, the cash flow, although positive is not massive but this has been put down to large projects taking up inventory, increase in debtors due to more exports and a large capex expenditure so we shall see what happens next year.  I guess the only thing really stopping me buying more of this share is that all this is probably priced into the share already. With a current P/E of 18.4 they are certainly not cheap and the current dividend yield of 2.9% is not stellar (not too bad though!).

So, I am going to hold on to my shares and look to buy on weekness (however, if the past performance is anything to go by I might be waiting some time).   I suppose a hike in dividends may tempt me to buy more too…

After the release of these results, the company announced it would have a tender offer for shares, whereby it would buy shares at 105% of the share price from shareholders.  In all, the group spent £5.2M buying these shares which will improve the EPS and P/E ratios.  It will be interesting to see how this impacts the cash flow but call me old fashioned – I would probably have preferred a dividend hike (I did not take up the tender offer).

In December 2011, there was a trading announcement that suggested turnover was at record levels and they had experienced a slight respite in the continued increase in raw material prices.  Therefore the profit was also expected to be at a record level.  In all, a very positive update.  It was noted, however, that the long standing Chairman was going to stand down – he will be a hard act to follow.

In January 2012 the above was re-iterated and it was also mentioned that cash reserves were increasing despite the share buy back plan.  This company really is performing well at the moment.


Sainsbury PLC – Interim report 2012

The interim results have now been published so I will have a look at those in closer detail, starting with the income statement for the first half of the year:

Although the total income is up on last year, this is only because of a favourable swing in the pension valuation.  The actual profit for the period is £45M down to £302M.  This is partly due to a reduction in the profit share of joint ventures but by far the main cause of this reduction is the fact that profit from the sale and leaseback programme is down by £68M to £38M.  The actual gross profit from normal operations is, in fact, up slightly from last year as it the revenue which due mainly to new stores is continuing to grow apace.  The borrowing costs increased slightly, mainly due to the increase in RPI, which is used to calculate the interest on some of the borrowings.  I believe the lower profits from joint ventures are down to a smaller surplus on the revaluation of the properties held in the property JV, as Sainsbury’s bank seems to be performing well.

Moving on to the balance sheet:

So, we see that net assets, and net tangible assets continue to increase.  Liabilities are up, almost across the board but so are assets. Sadly we see a further reduction in cash levels – down £137M to £364M but there is a higher value of property, plant and equipment suggesting further investment in buildings.  It can also be seen that inventories are up, due to increased selling space and continued increase in non food items sold.  Also we see Trade & Receivables up quite substantially to £415M.  I would not have thought a supermarket would have many trade receivables so I might guess this is to do with the joint venture, or increased sales of high value, non food items purchased on credit.  The pension deficit is, however, going in the right direction as it reduced £227M to leave it at a relatively modest £113M.

Now, let’s look at the cash flow:

We see here that Sainsbury’s is still losing cash – £163M over the first part of the year, they did however, lose less cash than in the same period of last year.  The increase in inventories was due to the inflationary increase of cost prices, the need to hold more inventory for promotions and an increase in goods in transit due to more direct sourcing.  More non food inventory was also held due to challenging market conditions leading to less sales than expected.  Cash from operations is actually up £116M on last year, mainly due to an increase in payables (so this money will still have to be paid out).  We see tat there are two items that indicate less cash inflow than last year – the first being an increase in the money spent on tangible assets – up £111M to a rather substantial £675M for the half year.  This indicates that the expansion plans are gaining momentum.  The second is a reduction in the cash received from the sale and leaseback operations.   These reductions have caused the group to take on more debt, with a net increase of £84M of long term borrowings.  As mentioned in the full year analysis, in the very long term this is unsustainable.

Although profit was down slightly on last year, the main cause of this was the reduction in the amount made in the sale and leaseback programme and the profit from other operations was up on last year.  We do still see a negative cash flow, however, due mainly to more capital expenditure.  The result is an increase in borrowing and debt.

We see here than the non supermarket areas are increasing earnings much quicker than the traditional fare (which is to be expected really) and the like for like sales from convenience stores are up by about twice the growth of the supermarket sales.  Sainsbury is continuing to expand in this area, opening two stores a week and have the increased prestige of earning the convenience retailer of the year.  Profits from the bank joint venture are up slightly and the company is expanding the offering with more credit card, insurance and travel money products.  They have recently started taking orders for travel money online.  The property JV is flat, with actual profits down due to a reduction in the increase of property values.   Another market being expanded is the pharmacy market and Sainsbury now have 200 pharmacists and have even started opening GP clinics in some stores – the total now is 3.

The direct sourcing of non food items has increased, with offices being opened in Hong Kong, China and Bangladesh to help with this.  After the opening of the Bangladesh office, the clothing shipments doubled.

Sainsbury continues to trade on its integrity and fairness, with sustainable fish being promoted and a new brand match service being introduced whereby the tills identify if the branded products cost more than in Tesco or Asda and refund the difference in the form of a coupon.  This is an interesting idea and will do a lot to redress the perception that these two competitors are substantially cheaper than Sainsbury.   In my last shop I was refunded 6p.  I should mention, however, that it was not lost on me that they are stating how many trees have been saved by printing their receipts on double sides and then issuing a paper coupon for my 6p refund!

Sainsbury also mentioned that they outperformed their rivals over Easter and the Royal Wedding bank holiday and id does seem to be the case that Sainsbury comparatively makes more money over holiday periods.

In conclusion then, this is another set of steady results, profits not including the property sales are up slightly but the worry for me continues to be the negative cash flow and the worry over consumer spending.  I am tempted to top up if the shares dip on macro economic news so for this reason I consider them GOOD VALUE.

Sainsbury have now released a trading statement for their Q3, including Christmas, and announced like for like sales up 4.8% on last year, and they gained market share from rivals.  As usual, non food items and convenience increased quicker but the board expect consumer spending after Christmas to reduce.  However, with the Diamond Jubilee coming up, not to mention the Olympics and European football championships, I believe the year looks fairly bright for Sainsbury.

In their Q4 trading statement, Sainsbury announced that total sales were up 4.6%.  Within this, the online vusiness grew by over 20% and the convenience business also grew by more than 20%, with sales increases being fuelled both by new store openings and increased like for like sales.  In the quarter, they also announced an investment in Tamar Energy who produce energy from organic waste – I can see how a supermarket may find this useful.  As before, with the events comming up this summer I am tempted to buy a few more of these.


J Sainsbury PLC Y/E 2011

33 Holborn, Chancery Lane, London, EC1N 2HT

Sainsbury is a household name and is by far the largest company that I have looked at so far.  They have had a recent bad time of it so let’s see if this is a buying opportunity.

For those who don’t already know, Sainsbury is one of the “big 4” supermarkets in the country.  They have a portfolio of nearly 1,000 stores comprised of both convenience stores and larger supermarkets.  It is rather focussed on an ethical and healthy image and, like its peers, is branching into non food items.  Indeed, Sainsbury is now the 7th largest clothing brand in the country.

They also have joint ventures in banking (with Lloyds TSB) and property (with British Land) and have a large property portfolio.  They recently entered into a partnership with British Gas to supply energy.

Moving on to the income statement.

So, the total income for the year of £673M, up £160M from the year before seems like a very positive result.  Revenue for the year is up more than a billion to be £21.1B.  However, we can see that cost of sales also increased by close to a billion to leave gross profit up a respectable (but not a massive) £78M up.

Looking down these figures we see that £108M was made on the sale of property.  This is a substantial amount more than in 2010 and adds a considerable gloss to these figures.  What Sainsbury is doing is a sale and leaseback on stores that they do not plan to expand or develop.  Although this is releasing money, it does seem a little short sighted to me.  We see the figures further improved by a lack of pension charges but we also see that borrowing costs are up to £136M, which is not peanuts.

One other item of considerable interest is the reduction in profits from their joint ventures.  These are profits from Sainsbury bank, the energy company and the property company and they have more than halved in the past year.  Finally we see the total income further flattered by a heavy swing in acturial gains on the pension scheme.

So, although the headline figures are up on last year I am a little cautious.  The increases in operating profits are completely wiped out by the decrease in profits of joint ventures and if we take out the property sales, and increases in the values of various items I make the overall profit down by £155M.  This is a very rough calculation but the point is that these results are not quite as good as they first appear.


EPS and P/E Ratio

Something linked with the income statement and the performance of the company is the Earnings Per Share (EPS).  This can be a good way of comparing performance on a like for like basis, taking into account acquisitions etc .  Related to this is the P/E Ratio.  This is calculated by dividing the share value by the EPS, thereby giving an indication of how much the market is willing to pay for the earnings.  Apparently a value of 15-20 is about average, and one lower than this can indicate that a stock is undervalued or that the market does not expect future earnings to improve.  The figures for Sainsbury are below:

EPS

2011

2010

PROFIT AFTER TAX

640,000,000

585,000,000

NUMBER OF SHARES

1,921,000,000

1,872,600,000

EPS

33.3

31.2

UNDERLYING EPS

26.1

23.6

SP

352.9

333.1

P/E

10.6

10.7

UNDERLYING P/E

13.5

14.1


Taking today’s share price, the P/E is a tiny 8.7 but various analysts expect the EPS next year to be about 27.1, leaving the forward P/E at 10.6 which, although rather low is exactly the same as the historical value in 2011 and seems fair.

Now to look at the Balance Sheet:

Net Assets overall are up £458M to £5.4B, with net tangibles up a similar amount.  Within this we see a vast increase of the value of property & buildings, with a similarly large increase in the value of equipment and fittings.  Presumably this is related to the opening of new stores during the year.  We also see an increase of goods available for resale (inventories), which also ties in with the increase in stores opened.  With regards to the current assets, we see increases across the board for receivables (£18M is receivable from the NHS and large amounts from credit card companies and external suppliers), while cash is reduced by £336M to be £501M.

Looking at liabilities, we see a fairly large increase in trade and other payables, suggesting a ramp up of operations offset somewhat by a more favourable pension deficit.  We see that long term borrowings are fairly constant at an eye watering £2.3B.  The provisions are made for onerous leases, group restructuring and long service awards.

On to cash flow:

Operating cash flow can be seen to be £102M above that of last year, but the headline figure shows a rather disappointing outflow of cash for the year of £334M.  Looking into it a bit further, we see that more cash has been tied up in inventories and receivables.  This is due to higher levels of non food stock to support sales growth and an increase in the level of goods in transit, driven by an increase in direct sourcing operations.  We can also see that higher interest figures and higher taxes (due to the higher paper profit) have affected cash flow.  There was also slightly more cash spent on acquiring property, plant and equipment.

There was a one off increase in cash from the sale and leaseback of some stores, as mentioned previously, and some cash was saved by paying back less in bank loans.  The figures for 2010 were somewhat inflated by £250M gained from share issues and £235M gained more borrowing which were not repeated to anywhere near the same level this year.  Indeed it should be noted that if it were not for these exceptional inflows of cash, the cashflow for 2010 would be negative also.

So, I feel that the cash from operations is not enough to sustain the huge amount of capital expenditure in property, plant and equipment (over £1B for the record) so unless Sainsbury can increase income, either the rate of investment needs to reduce or something else, like the (relatively) modest dividend payment could be under threat.


I will now have a quick look at the shareholder make up.


Largest Shareholders

Qatar Holdings                                  26%

Lord Sainsbury                                  5%

Judith Portrait                                   4.1%

Legal & General                                  4%


So, the standout figure here is the fact that Qatar Holdings, the investment arm for the Qatar Government.  They are buying up assets in Europe, originally to diversify from Qatar’s reliance on Oil and Gas.  They also own investments in VW and have recently bought Harrods and Paris St. Germain.  Lord Sainsbury is the grandson of the founder, and in total the Sainsbury family still owns a large chunk of the group.  Indeed Judith Portrait is a solicitor for the Sainsbury family and these shares are also owned by then by proxy.  Legal & General are household names in the investment world.

There have been constant rumours that Qatar holdings wish to up their stake and become more involved in Sainsbury’s, or even stage a takeover but these rumours never come to anything and I suspect they are attracted by the prestige of the brand and the large property portfolio and intend to keep it as an investment.

Overall then, we see that Revenue is up to £21.1B, most of this is due to new openings, but not all of it. Online and non food is growing at a much quicker pace than food, but I’m not sure this is sustainable. Profit is up to £640M but when the £108M from the sale and leaseback of property is taken into consideration, the profit levels are lower than in 2010.  Net Assets are very healthy, with more increases in the value of property but the negative cash flow is a bit of a worry. Share issues and new debt have masked the negative cash flow in 2010 and the current cash from operations is not enough to sustain both the dividend, and more importantly the massive £1.1B spend on tangible assets.

The UK supermarket arena is very competitive, but also rather profitable.  Sainsbury does not have any stores outside of this country so they are very susceptible to consumer spending and confidence, which is clearly at a rather low ebb at the moment.  In my mind, the have quite a good brand.  It is not trying to race to be the biggest discounter like Tesco and Wallmart who are the largest two supermarkets in this country but they have a strong ethical trading brand.  About a quarter of al fair trade sales in the UK are through Sainsburys and they were the first supermarket to make sure all their canned tuna was line caught, winning an award from Greenpeace in the process.

The group also has a very successful, quality own brand and sells more own brand products, proportionally than any other major UK supermarket.  Indeed, Sainsbury has a rather enviable reputation for quality and ethics while not being as expensive as the more premium supermarkets such as Waitrose and M&S.  They are focussing on expanding further into the convenience market, following in Tesco’s footsteps in this regard and like the other major supermarkets, are investing further into a non food offering.  The expansion plans continue, with the board expecting to add 1.25M square feet of selling space per year.

Another thing that they are doing is to sell and lease back all supermarkets considered “fully developed”.  Now, I understand the theory here that this money is better used further expanding the business but it is a trend that I don’t think I am fully comfortable with.  One of Sainsbury’s greatest assets is its property portfolio and by selling the stores off they are eroding this somewhat.  Also, I am not sure what is meant by “fully developed” and how this is measured.  I would have thought it was conceivable in the future that Sainsbury may want to expand in different ways and by selling the stores off, this ability would be hampered somewhat.

Sainsbury’s seem to be very well hedged against changes in exchange rates, with a 20% change in the GBP to USD or EUR rate only affecting the balance sheet by £1-2M.  The profits from the bank joint venture are up slightly to £11M and further increases are expected next year but net debt, by the end of next year is expected to be higher, at £2B

Overall then, profits are up but cash flow is negative.  I understand that this is a very competitive area and Sainsbury is expanding aggressively but at some point, in order to  make some cash without  increasing borrowing (which, given the property assets, Sainsbury can easily do), the capital expenditure needs to be reigned in somewhat.  Also, it is worth noting that the sale and leaseback programme gives the profit a bit of a gloss.  The company is trading on a ridiculously cheap P/E of 8.7, but this is including profits from sales of property and the future expected P/E is 10.6, which is historically where Sainsbury usually trades.  The dividend, if kept as is, is a healthy 5% and quite an attraction but I feel with the aggressive expansion and downturn in consumer confidence and the focus on just the UK economy, Sainsbury is probably more of a HOLD at the moment.  I will look to perhaps add more if the share price drops more or there seems to be an upturn in cash flow or consumer confidence.

In June, Sainsbury released a trading statement saying that sales are up 7.3%, which was driven by new store openings, increases in convenience trade, online and non food.  These are fairly pleasing figures.

In October, Sainsbury issued another trading statement where the story was much the same, sales were up 7.6% in Q2.


Ricardo PLC – Interim Results 2012

Ricardo Interim Results

Ricardo have now released their interim results, the income statement is below:

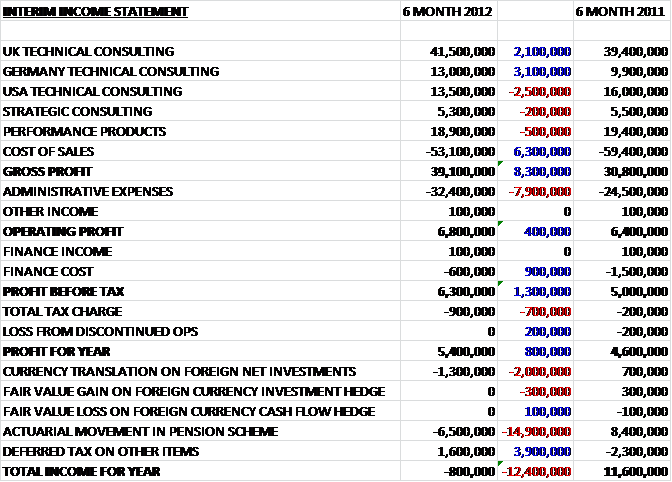
The profit for the half year is £800K higher than the same period last year at £5.4M, which is quite pleasing given the higher tax payment.  There is a mixed performance from the various different divisions.  UK and German technical consulting have both had a good period up £2.1M and £3.1M respectively but the USA technical consulting business suffered and is £2.5M down on last year at £13.5M.  Both the Strategic consulting and Performance Product business also did worse than last year, albeit only slightly.  Apparently strategic consulting is suffering as clients shift towards smaller more operationally focused projects.  In addition the people investment in this area has not resulted in larger revenues.  In fact the US Technical consulting division and the Strategic consulting division both made a loss in the period.  (500K and 300K respectively).

The cost of sales have reduced by £6.3M but the admin expenses are up £7.9M so overall costs are up slightly.  Admin expenses were increased as the group look to strengthen business development teams and have undertaken upgrades to some facilities.  We also see that there was a bad movement in the value of the pension scheme – it is £6.5M worse off, which, when combines with the unfavourable currency translation on foreign net investments of £1.3M has caused the total income to be negative, at -£800K.

The assets look like this:

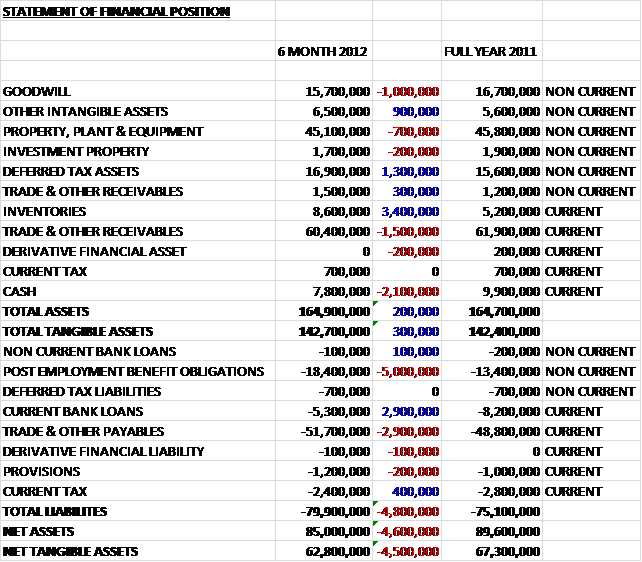
The net tangible assets are down £4.5 on the same period of last year.  The assets themselves have remained flat, with total tangible assets at £142.7M. Within this, we see that cash has reduced by £2.1M to £7.8M and inventories have increased by £3.4M to £8.6M.  I would suggest the two are connected and I would have thought this is an indication of a large project being undertaken in the Performance Product sector.

The Liabilities have increased by £4.8M to give a figure just short of £80M.  The main driver of this has been the increase in pension obligations, which have gone up £5M to £18.4M.  This is a bit of a shame as at the end of last year they seemed to have quite a good handle on the pension deficit.  Other wise the only differences are a reduction of £2.9M in bank loans and the same increase in payables.

Next, the cash flow.

The cash flow here is negligible, £5.5M down on the same period of last year but looking closer at the figures, we see that Ricardo benefited from a new increase in borrowings of £5.9M last year which does not reoccur this year so discounting this we see that the cash flow is on a par with last year.

Some other figures of interest are the fact that an increase in payables and inventories is balanced by a decrease in receivables.  I guess this suggests a transition in the cycle of sales where the group is stocking up before sales to a customer.  There is an increase in pension costs of £500K that pushes the cash from operations to a slightly lower amount than last year.  This is then counterbalanced by £600K less in pension finance costs (I will not pretend to understand exactly what is going on with that..).  There is also less tax paid counter balanced with higher dividends.  The figures last year also benefited from a one off £1.4M inflow of cash from the sale of the German exhaust subsidiary.  All this leads me to be fairly pleased with this reported cash flow.

NET DEBT HI 2012 H2 2011
CASH

7,800,000

-2,100,000

9,900,000

BANK OVERDRAFT

-3,300,000

2,200,000

-5,500,000

BANK LOANS MATURING IN 1 YEAR

-2,000,000

700,000

-2,700,000

BANK LOANS MATURING AFTER 1 YEAR

-100,000

100,000

-200,000

NET CASH

2,400,000

900,000

1,500,000


I have come to realise that the way cash flow impacts net debt is very important.  Here we can see that debts have reduced across the board and in fact Ricardo has a net cash position that increased by nearly £1M in the first half.  This is quite encouraging.

The group have stated that passenger car work has continued to progress with manufacturers looking to increase efficiency in their vehicles.  The motorsport sector seems to be going well too with a Peugeot car running with Ricardo transmission winning the Le Mans cup title. Emissions compliance regulation is also driving progress in securing business in the commercial vehicle and off road sectors.

Ricardo are making progress on a number of new products including a next generation efficient spray guided gasoline combustion system, a highspeed flywheel energy storage system for buses and a downsized gasoline engine with intelligent electrification.  All very technical sounding stuff that I hope will keep Ricardo going.

Overall this is an encouraging set of results in difficult market conditions.  The profit is up somewhat to £5.4M, although there is a mixed performance in the different market areas.  The balance sheet looks fine, although the pension valuation is causing a few problems.  The cash flow is fairly negligible but the dividends have been increased to 3.7 for the interim and there is a pleasing reduction in net debt.

The board have stated that the order book is strong, at a higher level than the end of last year and having just purchased some more of these after the last update I am going to hold on to the shares.


On 16th May 2012, the group released a management statement.  The orders for the year so far are comparable to last year, but orders for the last 4 months are lower than the same period of last year.  New work has included engine design work for agricultural vehicles, an engine programme for power generation, further work with a German motorcylce manufacturer and a rail transmission design programme for a Malaysian client.

Revenues for the period was 3% up on last year and the order book at the end of April is at the same level as last year.  The Technical consulting business has flat revenues but delivered better operating margins with the UK division doing well, offsetting slow trade elsewhere.  Germany has been difficult and revenues in the second half of the year are likely to be lower.  Trading performance in the US has also remained challenging despite some order intake from the defence and commercial sector.  Revenues in Strategic Consulting have been static but cost cutting has improved margins here.    The Performance Products segment seems to be doing well, being very busy.

Apparently the net cash balance remains positive, which is an advantage.

This statement seems to be a little disappointing overall.  It seems that total profits will be similar to last year but the lack of progress in the US and Germany is a little disappointing, especially considering the latter has not been that badly affected by the recession.   Hold.


Ricardo PLC – Y/E 2011

Ricardo PLC

Shoreham Technical Centre, Shoreham, W. Sussex, BN43 5FG

Ricardo is primarily a technical consultant.  They provide consultancy in a large number of industries ranging from automotive to sustainable energy. They also manufacture technical items such as car engines, transmission systems and other vehicles systems.  Some of the sectors Ricardo provide technical consultancy are as follows:

Marine – Ricardo offer advice and consultation on marine engines.  A particular driver is the need for marine transport to conform to certain emission regulations.

Clean Energy & Power Generation – Most of the technical consulting areas are vehicles but Ricardo also provides solutions for power generation, in particular in the Wind turbine sector.   The company provides drivetrain and other technologies to help improve cost, efficiency, durability and emissions from wind turbines.

Rail – Ricardo provide solutions to improve the efficiency of railway rolling stock.

Defence – Ricardo develops and provides vehicles for army use.  The UK MOD has ordered some of the “Ocelot” vehicles, and these are also being looked at by the Australian army.  The group also develops engines for unmanned droids favoured by the US.

Agricultural & Industrial Vehicles – Ricardo consults on improving the fuel efficiency of these vehicles.  The emissions legislation in this area is following that of the passenger car as governments continue to look for areas to reduce emissions, which is giving Ricardo more work in this area.

Motorcycles  – Ricardo have worked with BMW on an engine for various motorcycles.

High Performance Vehicles & Motorsport – Ricardo provides consultancy, design, development and production for motorsport teams and manufacturers.  Recently they have worked with McLaren on their engine for the new supercar and they work with the FIA, providing advice on how powertrain technologies relate to the 2013 regulations

Passenger Cars – This is the most important area for Ricardo.  They are involved in the development of fuel efficient engines and working with OEMs to make sure their cars are fully compliant with increasingly stringent emissions targets.  They are also involved in developing energy storage devices for cars and are currently working on a range extender powertrain.  Two main clients are Jaguar Landrover and The Great Wall Motor Company from China.

Government – Accounting for 1% of work, Ricardo consults on the electrification of transport and the knock on effects this has on the electricity grid.  This area is expected to remain challenging due to US and European government budget constraints.

In addition, Ricardo provide strategic and management consultancy in many of the sectors covered above and a new energy practice has been set up.  In addition to consulting services, the group also make high performance equipment such as drivetrains and supercar engines.  They have worked on the transmission of the Peugeot 24 hour Le Mans cars and the McLaren and Renault F1 cars; and have also provided the transmission for the Bugatti Veryon, the fastest road car in the world, along with that of the new McLaren supercar.

They operate in the US, UK, Germany, Czech Rep, France, Italy, Russia, China, India, Japan, Korea and Malaysia.

First I will look at the income statement.

So we see that both overall income and the profit for the year are higher than last year.  The total income is higher because the swing to a gain for the acturial valuation of the pension scheme (a £26.3M swing to the good).  The profit for the year benefited from the sale of the German exhaust business, which was the discontinued operation that drained £2.7M last year.

The profit before tax of £15.4 was £4.6M higher than in 2010 and looking closer we see that both revenue and costs have increased.  Revenue is up across the board but the £12M increase to £40.9 for performance products is particularly satisfying.  Staff costs increased by more than £7.5M which suggests the company is hiring more workers for the increased business so all in all, this is quite a good set of results.


EPS and P/E Ratio

I am now going to have a look at the EPS and the corresponding P/E Ratio.

EPS

2011

2010

PROFIT AFTER TAX

15,200,000

7,600,000

7,600,000

NUMBER OF SHARES

51,800,000

300,000

51,500,000

EPS

29.3

14.8

SP

404.5

130

274.5

P/E

13.8

-5

18.6


Taking today’s share price, the P/E is a historically cheap 12.3 but various analysts expect the EPS next year to be about 27.3, leaving the forward P/E at 13.2 which is a similar value to that recorded at year end 2011 so although the shares are a little cheap they do not seem to be a huge bargain on this valuation.

Now to look at the Balance Sheet

We see here that net assets are up £24.8 to a respectable £89.6 but when looking further we see this is almost entirely driven in a reduction in pension obligation liabilities of £21M to £13.4M so Ricardo has obviously been working hard to reduce the deficit to a more manageable level.  Still looking at liabilities we see that the group is doing a good job of paying off its bank loans, which are down£9.4M to leave bank borrowing at £2.7M  (although the bank overdraft is up slightly).  The only other significant movement in liabilities is the £7.6M increase of payments in advance to £20M.  This is not too concerning as far as liabilities go as it is not really an indication that the group needs to pay out a certain amount unless the work is not done.

The assets remain fairly stable throughout the year with the biggest movement seen in the £12.1M increase in trade receivables to leave that at £38.5M.   This could either be due to increased work (good) or Ricardo’s customers are taking longer to pay (bad).  I suspect it is a mixture of both.  There is a disappointing dip of nearly £6M in the amounts receivable on contracts, perhaps a major contract is winding down.  The only other items of note, I think, is the pleasing increase in cash to just under £10M and the £2.5M fall in inventories.

Shareholder Makeup –  A quick look at the shareholders who own more than 3% of the company reveals that they are all investment and asset management companies, with the larges being Delta Lloyd Asset management at just under 14%.

Cash flow:

I think the cash flow here is a good example of the importance of delving deeper into the figures, and combining the cash flow figures with other financial data.  The overall cash flow is negative, albeit only slightly but within this we see that the group has paid back a net £9.8M in bank loans.  Looking back over the balance sheet we see that bank loans and overdraft liabilities are £8.2M so if we get a similar cash flow next year, Ricardo will be debt free and accumulating cash to be spent on shareholders or (hopefully) useful acquisitions.  So, I think the cash flow here is probably better than it initially appears.

We can see that cash from operations is up due to some of the reasons touched on in the income statement analysis.  We also see less money tied up in inventories and that there is also an increase in payables, suggesting Ricardo may be holding onto their money to aid cash flow (I will keep an eye on this in future statements).  The cash flow is negatively impacted by a slightly larger spend on capex and an unfavourable shift in the exchange rates.


Overall then I believe these are a fairly good set of results.  We see that profit for the year is up 7.6M to 15.2M, primarily due to increased revenues and net tangible assets are up £21.6M to 67.3M due to a favourable shift in the valuation but the cash flow is slightly negative at -£300K.  We see, however, that the shift in net debt is a positive one to the score of £9.3M, leaving the group with net cash and a very favourable gearing level of -3%.  The current P/E is fairly cheap at 12.3 but analysts are expecting a lower EPS next year and the forward P/E is a more average 13.2.  The dividend is fairly decent, although not stellar at 3.2% but the cover, at 2.7 is very respectable.

It is fair to say that Ricardo are in a very good position to benefit from the increased regulation regarding emissions as they seem to have carved themselves somewhat of a niche for coming up with fuel efficient engines and other mechanical solutions and we see regulation not just for passenger cars in the US and Western Europe but now rail and marine industries are being affected.  It can also be seen that the BRIC countries are increasingly looking to reduce carbon emissions, thereby offering more opportunities for Ricardo.  In a similar vain, Ricardo are also developing their wind turbine technologies to capitalise on this trend in the energy sector.

The board have stated that the UK and German technical consulting divisions have experienced increased orders, but this is somewhat slower in the US.  However many of the large auto makers are continuing to outsource R&D to companies like Ricardo.  As well as the traditional business of the passenger motorcar, there seems to be an increasing opportunity for the group in the defence sector.  The UK MOD have ordered over 200 Ocelot vehicles and the Australian army is also looking into this.  In the US, Ricardo have developed the engine for those flying motorised droids that the States use to harass the Taliban. In fact, Ricardo seem to be diversifying well with the strategic management consulting recovering somewhat with a new office opened in India to support the Asian market and the group has expressed a desire to cross sell this consulting to some of their technical consulting clients.

There are two clients that represent 17% and 14% of their revenue so the loss of either of these would have a detrimental effect on results and due to the contractual nature of this business, the group could find themselves involved in work that costs more than initially expected.  There is also a fairly large pension deficit here but having said that, the deficit is reducing and Ricardo have stated their intention to eliminate the deficit sooner rather than later.  Currency changes have little effect on the group but a 10% weakening of the Euro would have a £100K detrimental effect on results.

In conclusion then, I like Ricardo.  I like their product offering, I like their reducing debt and net cash and I like their focus on solutions for emissions regulations.  On the other hand, their dividend yield isn’t massive (but it is well covered), the shares are higher than they were when I originally purchased (always a difficult psychological barrier for me) and although good value the P/E ratio is not exactly cheap.  So, considering this I may try and break my fear of “averaging up” and will look for a good entry point to try and buy some more.

On the 17th November 2011, Ricardo issued a management statement for the 4 months to the end of October.  They  stated that Revenue was 8% up on the same period last year, and the order book is also higher.  The Technical consulting business has seen strong orders from Asia, the UK and Germany but weaker performance in the US business.  The strategic consulting business is not making progress, despite some investment due to clients reducing spending due to the poor economic conditions.  The performance products business is seeing volumes of the Supercar engines ramping up and the start of the production of Ocelot vehicles.

The struggling strategic consulting business is disappointing but overall I can see enough in this statement to reinforce my earlier sentiment.

On 10th Jan 2012, the group released a trading update which basically reiterated what was said in the management statement.


Swallowfield PLC Interim Results

Swallowfield Interim Results

Swallowfield have now released their interim results, the income statement is below:

We can see that profits for the first half of this year are fairly flat – the profit after tax is £535K, only 16K up from last year.  Within this we see revenue is up £251K to £31.5M, with a fairly large increase in EU revenue, being offset by small reductions in UK and ROW revenue.  The cost of sales have increased somewhat to £447K to give a gross profit figure slightly down.

An increase in the income from the pension scheme is what pushes the profit slightly into the positive compared to last year.

The assets look like this:

The net tangibles assets have remained fairly steady, with a reduction of only £150K.  We see that although assets have reduced, so have liabilities.  Although there is a small increase in property, plant and equipments the main points to note here are a £819K reduction in inventories to leave £7.6M; a £1.3M reduction in trade and receivables to leave £12.4M and a £569K reduction in the cash levels to leave these rather low, at £617K.  Without having any other information, it would seem that trading levels may have reduced somewhat.

Similarly, we can see that trade and other payable have decreased by 2.5M to give a total of £15.9M. There are other small movements in liabilities but these are not very significant.

Next, the cash flow.

The cash flow result is a little disappointing.  We see a £2.1M swing to the negative to produce a cash outflow of £569K for the half year.  The two largest causes for this are the fact that inventories are decreasing by less than last year and the fact that payables are decreasing at a faster degree than receivables.  Other than this, there is a £115K increase in capex on property plant and equipment to leave this at £838K and a repayment of some debt – there seems to be a net £1.4M pay back of debt, which drags the cash flow down further.  It should be noted, then, that taking this into account, the outflow of cash is less than the repayment of debt, hence showing a decrease in net debt – these figures are better than they initially seemed, then.

There is a desire to grow export markets due to the week market in the UK and the group expects to start shipping new products in the second half, which should help revenues.  It is also noted that, although the prices of raw materials increased during the first half, these prices are showing signs of stabilizing.  Two new products Swallowfield seem particularly excited about are a wood clenched cosmetic pencil (not sure what this is but they have generated a few new business wins on the back of this) and a sun care aerosol product.

Overall then, to be honest, these results are not that exciting!  The profit remains steady with a slight increase in revenue, the net assets are fairly flat but both payables and receivables have fallen, the cash flow is slightly negative but with the repayment of some debt, the net debt has reduced slightly and the interim dividend remains the same (although the board are looking to strengthen the dividend cover in future).  In my opinion, these results are a bit of a side show to the board room wranglings that are still taking place.   After being forced to resign, it seems the board have had to reinstate McDowell at the request of Western Developments.   There is also a rumour that Gyllenhammar is looking to sell his stake (that would only be a good thing for SWL in my opinion)

I am going to Hold on to my shares here to see what happens with regards to the largest shareholders.


Swallowfield PLC

Swallowfield House, Station Road, Wellington, Somerset, TA21 8NL

My Swallowfield shares have trod water over the last two years so let’s see what is going on.

Swallowfield manufacture cosmetics and aerosols to brands and supermarket own labels.  They have manufacturing plants in the UK and the Czech Republic and sell their products in in UK, continental Europe and some other parts of the world.

 This industry has not been very badly affected by the international financial problems, but Swallowfield is susceptible to increasing raw material costs, particularly Aluminium and Oil.


This looks like a fairly good, if rather unexciting set of results.  revenue is up somewhat across all regions, while wages increased by only £223K.  Other cost of sales increased by nearly £5M to £35.9M.  I am not sure what these costs are exactly but they have pretty much wiped out the increase of income to make Gross profit close to that of last year, at £6.8M.  Looking at other costs, we see that there was £100K paid out for a special GM.  The purpose of this was to vote on and depose the existing Chairwoman (more of this rather sordid episode later on).  Foreign exchange changes swung to be slightly beneficial for the group operations.  Finally, here we see £5.2M in other admin costs.  Again, I’m not too sure what they relate to but they remained fairly constant.

 There aren’t any other major gains or costs here, the headline figure of £1.2M for the total income is a respectable £300K over the figure last year.


EPS and P/E Ratio

Something linked with the income statement and the performance of the company is the Earnings Per Share (EPS).  This can be a good way of comparing performance on a like for like basis, taking into account acquisitions etc .  Related to this is the P/E Ratio.  This is calculated by dividing the share value by the EPS, thereby giving an indication of how much the market is willing to pay for the earnings.  Apparently a value of 15-20 is about average, and one lower than this can indicate that a stock is undervalued or that the market does not expect future earnings to improve.  The figures for Swallowfield are below:


EPS 2011
2010


PROFIT AFTER TAX 1,082,000 161,000 921,000
NUMBER OF SHARES 11,306,416 15,616 11,290,800
EPS 9.6
8.2
SP 110.0 -13 123.0
P/E 11.5 -4 15.1


Taking the share price for today, the P/E is 12.3 which is fairly undemanding.


Now to look at the Balance Sheet:

So, again this looks fairly good – with only the cost of software licences as an intangible and no Goodwill to get in the way, we see that net tangible assets are up slightly to £13.3M, and net debt is only £4.3M so there is a respectable gearing of 38%.  Also, in the asset segment we see an increase in Trade Receivables which either suggests more customer orders or a lengthening of customer credit terms.  I suspect the former, given increases in revenues.  In fact, out of those trade receivables, only £707K is overdue, and out of that only £2K is over 90 days old, so they are doing quite a good job of keeping on top of customer payments.  The £167K of property for sale relates to a warehouse in North Devon that the group is trying to offload.  The group expect to be able to sell it this year.   Also, cash(my favourite asset) has doubled to £1.2M.  Looking at liabilities, we see that Trade payables increased by £1.5M but bank loans have reduced considerably.  On this list the new secured debt facility of £4.9M is listed under “other payables” for some reason, this caused net debt to increase slightly over last year.   Finally, I think that the pension liability of £2.4M is quite large for a company of this size, so hopefully an eye is being kept on this.


Next, I will look at the cash flow, which is another important indicator of the health of a company.  No company will survive long term with a negative cash flow.


So, much like a lot of the other indicators, the cashflow statement seems rather subdued.  We see that overall cash has increased by £2.5M over the year, but this is accounted for by the £4.9M new debt facility, which we saw earlier on the liability statement.  Both trade receivables and payables are up, showing an increase in trade levels and quite a substantial (relatively) purchase of property plant and equipment also suggests an increase in production levels.  The £98K purchase of financial assets relates to an increase in a stake in the Chinese associate SCCTC, which the company now owns 19% of.


Finally I will have a quick look at the shareholder make up


Largest Shareholders

Peter Gyllenhammar                      29.6%

Western Selection                           16.5%

R&A Persey                                        9.2%

J&L Wardell                                        6.7%

AP & TM Dowsett                            3.5%

MA Wardell                                        3.2%


The shareholders here have a very direct bearing on Swallowfield.  Peter Gyllenhammer is a Swedish “activist” investor who invests in companies which he considers undervalued or badly run and instigates changes.  He tends to want to have a representative on the board to represent his interests (Stephen Boyd has been appointed for this role) and has so far managed to oust the Chairwoman.  The performance of Swallowfield was not actually that bad and I think the company has been involved in this rather than expending its efforts elsewhere to increase performance.  Western Selection is an investment company that also has links to Gyllenhammer.  I am not sure who the other individuals are but I believe they are ex-directors.  Overall a lot of the equity is tied up between these shareholders.


So, what have we learned about Swallowfield?  Profit is fairly flat (and has been pretty much for the last 5 years), net debt is up slightly and there is a slightly negative cash flow (taking out the new debt facilities) and a large shareholder making trouble so this is a company going nowhere fast at the moment.  Conversely there is a very attractive dividend yield to be had here but the board has suggested they will strengthen the 1.5 times cover in future to allow for more investment and less debt and there is nothing in the results to suggest any nasty problems in the short term future.


One issue that may be of concern is that Swallowfield relies heavily on two customers which between them account for 46% of revenues.  If there were any problems with these clients then clearly Swallowfield would be in a spot of bother.


The group is not especially exposed to exchange rate changes – about 14% of revenues are invoiced in Euros and 6% in USD.  Conversely most of the raw materials are purchased in USD so I’m not sure whether GBP weakness or strength would be favourable.


Trading conditions have been described as tough in developed countries but more robust in developing markets.  The products that Swallowfield make are relatively inexpensive luxury items or everyday consumer products so they are not expecting sales to be adversely effected by changes in consumer confidence.  The bigger risk is other round of customer destocking and consolidation.  Also, the increasing oil and aluminium costs have been hard to pass on to customers so margins are being squeezed.


The board have stated that the NY sales office has achieved its first new business sale (about time), the first shipments have been made to South Africa (more opportunities there are being evaluated) and the group is looking to enter the South American market through Colombia so there are plans for more international sales.


Overall then, the shares are moderately valued at a P/E ratio of 12.3 and there is a dividend yield of over 9%.  Earnings are starting to pick up slowly but there is not yet any indication of cash generation and I suspect the yield will be cut to allow for more investment.  There is value to be had here, I think but so far I would rate this share as a HOLD, with a view to perhaps buy should there be more evidence of progress.


On the 12th Jan 2012, Swallowfield announced that Stephen Boyd had been promoted to the position of chairman and Martin Hagan had been demoted to senior independent director.  At the same time, Roger McDowell has been forced to resign, angering Western Development who suggested him in the first place.  This sideshow is now becoming the main show for this company as the current board try to resist the will of the largest two shareholders.  This must be taking time away from other duties and I am wondering if it would be prudent to sell these shares before this drags on any further.