National Grid Blog – Interim 2012

National Grid has now released its interim results for the first half of 2012.

nationalgridinterimincome


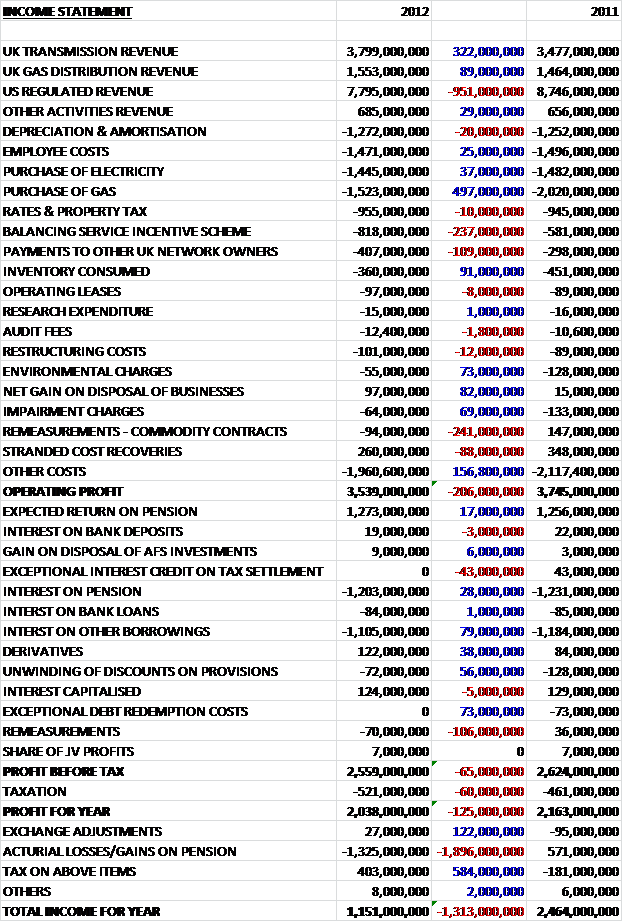
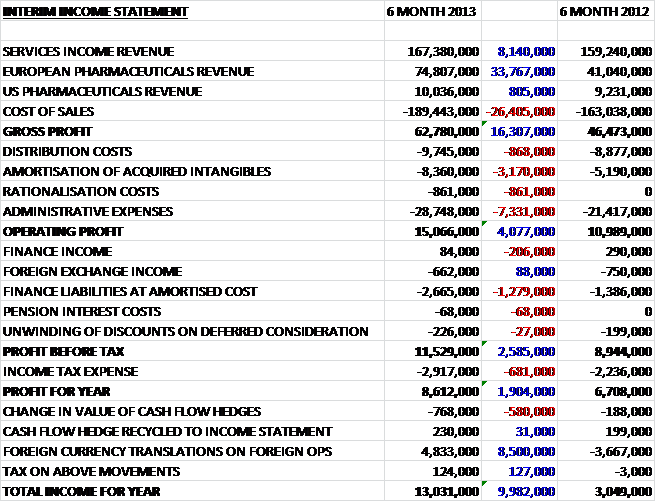
A bit of a mixed bag here.  We can see that revenue from the UK business is doing well, up by £262M but this was counteracted by a £442M fall in US revenues and a £49M fall in other activities (all main sectors increased profits).  The cost of sales was down too, however, so gross profit managed to increase by £172M.  There were less restructuring costs and a lack of environmental charges, which helped,  We can also see that remeasurements on commodity contracts gained an extra £162M on last year, this was offset by a £153M reduction in the stranded cost recoveries, which look like they have worked their way through the system now.  This means that operating profit was £250M better off than in the same period of last year.  The profit from Joint Ventures related to dividends from Iroquois Gas Transmission System and Millennium Pipeline Co (both for £4M).  The share of profit from joint ventures increased mainly due to the larger contribution from the BritNed interconnector.

After interest and taxation has worked its way through, the profit for the year was £253M up at just over £1B.   Looking at total comprehensive income, however, we can see this was wiped out by a £1B actuarial loss (presumably on the pension scheme).

nationalgridinterimbalance


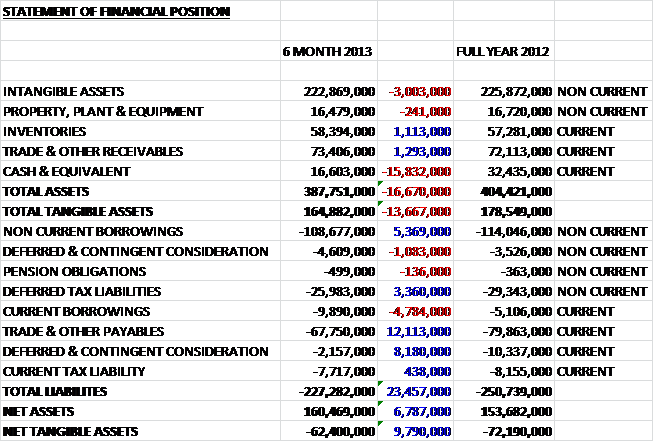
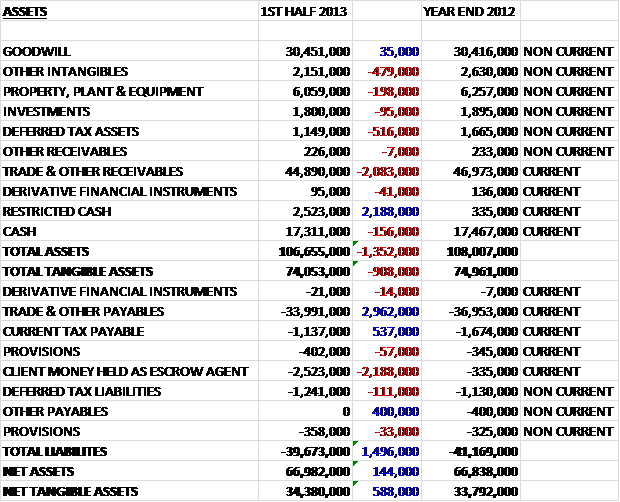
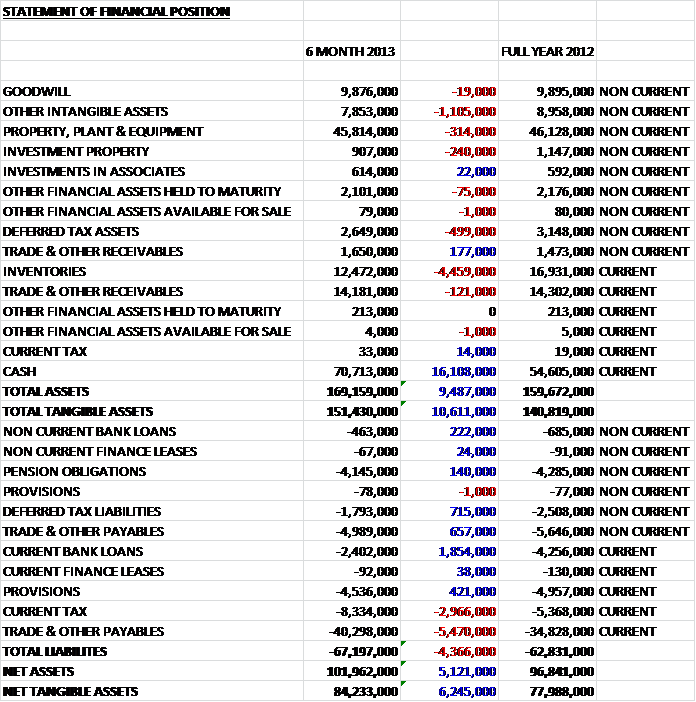
The total assets for the group increased by £1.117B during the half year.  The bulk of this increase, as usual, comes from the capital invested in property, plant and equipment which now stands at a staggering £34.7B.  Other large increases came from financial investments and derivative financial assets.  The only significant decreases were trade and receivables, down £260M and the sale of the business held for sale meant a reduction in value of £264M as far as that was concerned.

Liabilities also increased (up £1.242B), driven mainly by an increase in borrowings of over £1B.  The other big increase comes from pension obligations which were up a worrying £689M to £3.777B. Not all liabilities were up, however.  There was a £466M reduction in trade and payables and a £251M reduction in deferred tax liabilities.  Overall, liabilities increased at a faster rate than assets so net tangible assets were £83M down to £4.387B.  Considering the business strategy for National Grid, it is quite important for them to increase value so this is a bit of a disappointment.  It could be argued that were it not for such a large hike in pension obligation, however, this would have been achieved.

nationalgridinterimcash


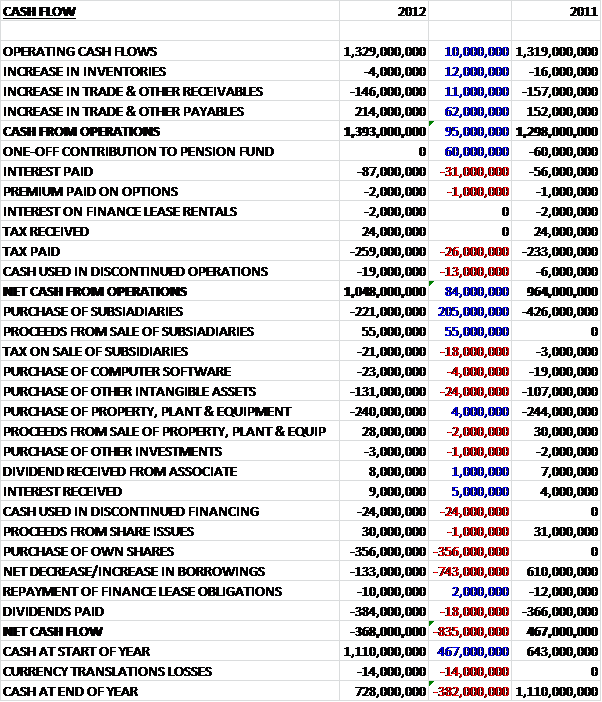
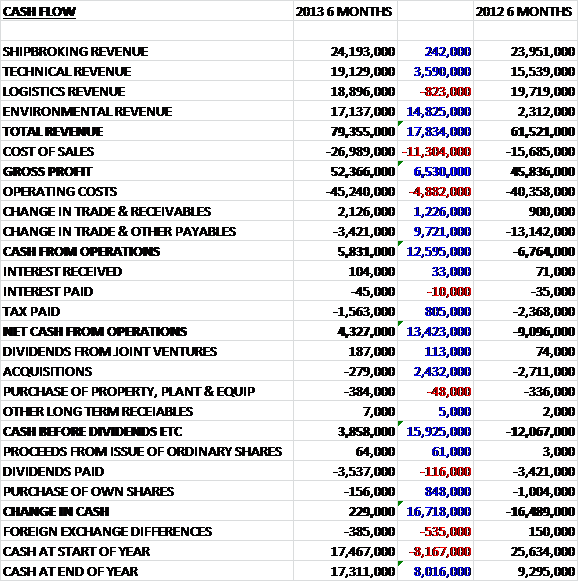
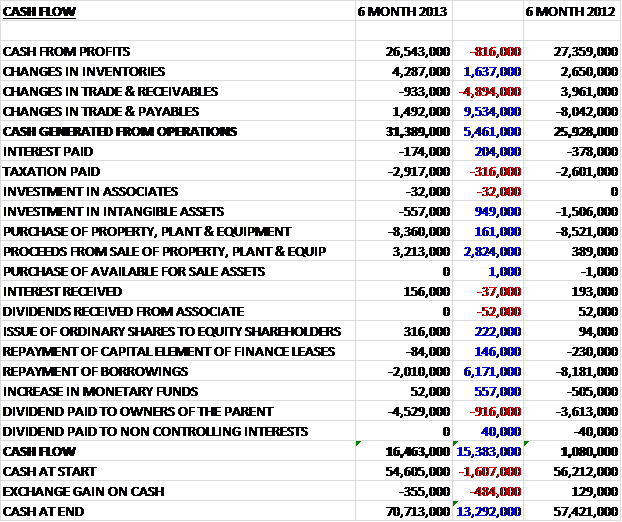
We can see here that after adverse changes in working capital, brought about by weather and commodity costs in the US,  and a smaller tax payment, the net cash from operations was £41M lower than the same period of last year at £1.694B.  This was almost entirely swallowed up by capital investment in property, plant and equipment (£1.648B, up by £174M). The increase in capital investment for this half year was due to investment in the UK transmission business and an increase in the gas transmission equipment investment in the US.   Another large destination for the cash was movements in short term investments.  Before we even consider the interest paid (394M) and the dividends (£470M), we were in a position of negative cash flow so a net £1116M of new loans was required to keep things on an even keel.  At the end of this, there was a positive cash flow of £77M but this seems pretty much academic as National Grid just borrows more money to cover any shortfalls.

The dismissal of the anti-trust claims relating to the KeySpan class action was confirmed on appeal, which leaves the only course of action available to the claimants is to petition the supreme court to overturn the decision so the slight cloud hanging over the group with regards to that seems to be gradually lifting.

In October superstorm Sandy hit the NE US, affecting the power supply to National Grid customers.  The group are expecting the financial impact of this to be about £100M. It does seem that lessons have been learnt from past storms, however, and restoration targets were met in New York, Rhode Island and Massachusetts.  Long Island was more severely affected, however, and it is unclear whether any fines will be levied here due to not meeting targets.

New UK guidelines for future tariffs are expected to be outlined by the government later in the year and will determine the framework for investment into the infrastructure of the system for the next decade or so.  This is a very important framework and National Grid will align their business accordingly.   Negotiated settlement recommendations for new rates in the Long Island Generation, Rhode Island (a 9.5% RoE) and New York (9.3% RoE) businesses have been agreed in principle and if agreed will enhance takings in those markets.

In the first half of the year, there was a £28M over-receipt which will have to be given back.  Operating profit was £185M up on last year but that included £71M of costs relating to Hurricane Irene.   The rest of the increase was predominantly down to the impact of inflation linked returns from the UK businesses.

For UK operations, UK inflation is expected to contribute £75M to the allowed gas distribution fees this year and the one year transmission review increased the amount of allowed revenues by £200M.  UK controllable costs and depreciation are expected to increase, reflecting inflation, staff recruitment and high levels of capital investment.  For the US, reductions in controllable operating costs are likely to be offset by inflation and other cost increases.  The effect of Superstorm Sandy is likely to be about £100M.  Additional costs associated with the US financial system and process implementation are expected to impact the results of other activities.

Operating profit for UK Transmission operations was 18% up to £712M and there was a £10M balance of under-recovered fees at the end of the half year.  The increase was due to the rollover of the transmission price control agreement and included an increase for RPI.  Costs increased somewhat, mainly due to ongoing recruitment and development of the UK operating model.  The system reliability was excellent during this period.  For the rest of the year, costs are expected to increase, offset by an increase in income and the continued recovery of under-recovered revenues.

Operating profit for UK Gas Distribution was 7% up to £408M.  The increase was due to higher regulated income due to the RPI linked tariffs.  Costs were up a small amount too, mainly due to increased emergency workforce costs.  The five year price plan for Gas Distribution in the UK is shortly coming to an end so it will be interesting to see what is achieved in the next price plan.  Capital investment in the gas distribution business is at a broadly steady rate and involves work on mains replacement.

Operating profit for the US regulated business was up 27% to £404M, which includes an over-recovery balance of £39M which will have to be paid back to customers.   The increase in profit is also due to the fact that this period of last year included £71M in respect of hurricane Irene and recovery of deferred costs from the New York electricity business.   Reliability was fairly strong, with 14 out of 15 targets met.  The sale of the New Hampshire electric and gas distribution business, Granite State Electric Co was completed to Algonquin Power & Utilities Group in July. The main areas of new investment were increased spend on transmission and mains replacement in the Massachusetts gas business.  The clean up after Superstorm Sandy has involved over 15,000 crews and took significantly longer than Hurricane Irene last year.

Operating profit for other activities fell by 48% to £68M.  This fall was due to an increase in costs related to US systems and finance restructuring and the sale OnStream metering services in October 2011 (OnStream contributed £12M in the first half of last year).  LNG storage profits remained similar to that of the same period of 2011.

After the increase on contribution from the BritNed interconnector, the group is looking at other similar joint ventures such as interconnectors between the UK and Norway, Ireland, Belgium and France.

All in all, not too bad I guess.  US revenues are down, counteracted in increases in UK revenues but costs were also reduced and the group recorded a decent increase in profits.  Net assets sadly fell as a huge increase in pension obligations seemed to take its toll.  All of the cash generated is used in capital expenditure and the group just borrows more and more money to pay for everything else.  Net Debt Now £20.358B, up £761M on the end of last year as the group issued new bonds, including the largest Canadian Dollar bond yet, in order to diversify sources of liquidity.  By the end of the year, net debt is expected to reach £21B.  I am not sure why OnStream was sold as this seemed to generate profit and diversified the group away from regulated income so I was a little sad to see that go.  Also, the costs of the cleanup following Superstorm Sandy will be included in the second half results and that will be significant.  The dividend is up slightly to 5.1% and a new policy will be announced by May 2013 following the outcomes of regulatory developments.

In conclusion then, I am still not sure what to make of National Grid.  The business model just can’t be sustainable long term but the 5.1% return with the dividends is considered safe.  So I suppose I will continue to hold and maybe sell out if something more interesting comes along.

On 17th December, Ofgem announced the plans for future investment into the UK gas and electricity grid. £24.2N was earmarked to upgrade the structure, some £7B less than was requested.  £4.5B of this will be made available only if companies can justify the expenditure.  £15.5B of this money is to upgrade the high voltage electricity transmission network in England and Wales and the high pressure Gas network across the whole of Britain.  A major project includes the building of a sub sea link to connect Scotland with England and Wales.  The other £8.7B is to ensure Britain’s low pressure gas networks remain safe and reliable and include strict targets for network companies to carry out Carbon Monoxide awareness initiatives.  It is good to have this set out, it is a shame that there is a £7B difference but I am not sure if this was predicted or not.

On 21st December, the group announced that the rate submission for Rhode Island has been agreed.  The plan includes a 9.5% RoE, pension trackers and increased operating cost allowances.  The rate plans provide a revenue increase of $21.5M for electricity operations and $11.3M for gas ops.  There is also an annual property tax recovery mechanism that more closely aligns rate recovery and costs related to property tax expenses.  This seems like a decent outcome.

On 17th January 2013, National Grid announced that a rate extension for the New York gas business had been agreed.  The proposal includes a 9.4% RoE and includes a clause whereby 20% of earnings above this amount can also be retained by the group.  The proposed agreement also includes an increase of capital expenditure allowances and updates to customer service and performance metrics.  This agreement will run for two years and is financially very similar to the one which it replaces.

On 29th January 2013, the group issued an interim management statement which went over some of the previous announcements and went into more detail about other issues.  It was stated that capital investment during this year would be around £3.6B.  It was also mentioned that the group had not finished going through the Ofgem proposals to check for the acceptability of the plans, that process is due to be completed by Match.  Another development was the fact that the NYPSC has granted an order so that thew current recovery surcharges of about $65M per annum be extended to recover past expenditures of around $200M.

In Massachusetts an order detailing $19M of penalties relating to the response to Tropical storm Irene and the October Snowstorm was issued.  National Grid are appealing this amount.  The update went into a bit more detail on the Rhode Island rate that was agreed in December.  The effect of this rate change will increase annual revenue allowances for electric operations by $21.5M and for gas operations by $11.3M, which sounds fairly promising.

During the period, the group updated a number of IT systems and this caused problems in payroll processing.  Hopefully this will not be a big issue and staff members will be paid appropriate amounts – not sure how a company with the resources of National Grid can suffer these kind of IT problems, though.  There has been no material changes in the financial position of the company and the group was able to obtain £1B more of long term debt to add to the debt they currently have.

Going forward, as the group continues to digest Ofgem’s proposals, more clarity is being given to operations and the plans are likely to control the direction in which National Grid goes in future.

On 28th February, National Grid announced that it had accepted the price control arrangements proposed by Ofgem as the board believes that the combination of revenue allowances and incentive mechanisms provide a good opportunity to earn appropriate returns for investors.  It also offers the longest ever period of regulatory clarity – this seems like good news to me.

On 15th March, the group announced an agreement for the New York set rates.  The three year rate period allows a 9.3% RoE and increased operating cost allowances.  There is a cumulative revenue increase of $123M for electric operations and a $9M increase for gas operations by the end of the third year.  The rates include a capital expenditure program of $1.6B.  Sounds good for electric operation, but I guess there is a revenue decrease for the electric operation in the first year or two.

On 28th March, National Grid announced their new dividend policy.  It is intended that the dividend will grow at least in line with the rate of RPI inflation each year.  Funding going forward will be sources from retained equity and increases in net debt.  Trading towards the end of the year has progressed well and earnings are likely to be slightly ahead of previous expectations where stronger trading in the UK transmission business and lower net finance costs should counteract the effect of the storm restoration work.


National Grid Blog – FY 2012

National Grid is a company that I have been invested in for a while.  They were perceived lower risk and something I used to diversify my portfolio somewhat.  I am now going to attempted to decipher the rambling 200 page annual report and provide some meaningful analysis.

National Grid was listed on the London Stock Exchange in 1995 having been originally part of the British Gas group.  The group is split into three main segments.  The UK transmission business includes high voltage electricity transmission networks, the gas transmission network, LNG storage activities and the French electricity interconnector.  The UK Gas Distribution business includes four of the eight regional networks of the UK’s gas distribution system.  The US Regulated business includes gas distribution networks, electricity distribution networks and high voltage electricity transmission networks in New York and New England, and electricity generation facilities in New York.

Activities not included in the above business are a UK gas and electricity metering business, UK property management, a UK LNG import terminal and other LNG operations, US unregulated transmission pipelines, US gas fields and some corporate activities.

In the UK electricity industry, National Grid own some of the interconnectors with France and Netherlands which allows electricity produced in each country to be used to meet demand in the other countries and capacity on these interconnectors is sold through auctions. National Grid also owns and operates the transmission systems in England and Wales (power lines and the like) and are paid by generators, distribution network operators and suppliers to connect their assets to this system and to transport electricity on their behalf – these charges are reviews annually.  These companies also pay the group to balance the system and to ensure demand is met.

As far as the US electricity business is concerned, National Grid owns 57 oil and gas power stations on Long Island and 4.6 MW of Solar energy units in Massachusetts.  The group use this and also buy energy made available in the New York ISO market for their own requirements and to sell on.  They also own and operate electricity transmission facilities in New York, Massachusetts, Rhode Island and Vermont.  In addition they also own a transmission connector between New England and Canada and operate the transmission system on Long Island until the end of 2013, when that will be taken over by another company.  They are permitted to recover the cost of electricity transmission from their customers as a transmission charge.

Distribution facilities actually transport the electricity from the substations to the end user.  National Grid maintain and operate the distribution system in Long Island until the end of 2013 and own distribution facilities in New York, Massachusetts, Rhode Island and New Hampshire.  Customer bills include the commodity rate, and a delivery rate.  All the states National Grid operate in are deregulated and customers have the option of buying their electricity from other companies.  If they do this, they are only charged by National Grid for distribution.

In the UK gas industry, National Grid owns and operates an LNG importation terminal at the Isle of Grain in Kent and the group charge importers to land LNG at this terminal.  National grid are the sole owner and operator of the gas transmission infrastructure in the UK and all gas produced or imported must travel through their pipes.  Shippers are charged for the use of this grid at both entry and exit of the system.  There is also a commodity charge based on the actual gas flows through the system.  When the gas leaves the transmission system it is odourised and enters the distribution system, where it can also be stored.  National Grid own four out of eight UK regional distribution networks.  The gas is still owned by the shippers and they pay for their gas to travel and be stored in the distribution network.  These charges reflect the costs of building, maintaining and operating the network in addition to operating an emergency telephone helpline.  It is unclear what kind of profit margin is built into the charges.

In the US, National Grid own and operate LNG storage facilities both for their own use and storage for third parties (for a fee).  They purchase gas directly from the producers and importers for resale to customers.  The group then pay to the owners of the national pipeline network to transport the gas to the local distribution networks owned by National Grid.   This local network is used both for the gas that National Grid sell to customers and that belonging to third parties.  Customers then have the choice of buying the gas through Nation Grid or other suppliers using the network (much like the deregulated US electricity market).

National Grid also have a joint venture with TenneT that built a subsea electricity link between the UK and the Netherlands, they have a metering service to install and maintain meters for energy suppliers in regulated market in the UK, they have a property company that manages their properties in the UK.  They also have an interest in LNG storage and road transportation in the US.

The income statement:

nationalgridincome

Starting from the top then, revenues were up across most business units, with the exception of the US business which fell by nearly £1B to £7.8B.  The one thing I will say is that National Grid has a huge amount of assets – just look at that depreciation/amortisation charge – £1.3B!  It was relatively unchanged from last year, however, as were the employee costs and electricity purchase costs (all of which were over £1B).  The cost of the purchase of gas was down considerably (nearly £500M to £1.5B), whereas the balancing service incentive scheme was £237M higher to £818M – I am not too sure what that is, but it is a lot.  Another large cost increase was the £109M increase to £407M for payments to other UK network owners.  Again, I’m not too sure what has caused that but it is a big increase.   The two other big swings to the negative when compared to last year were the remeasurements on commodity contracts (£241M swing to the negative to £94M) and the stranded cost recoveries, which were £88M lower at £260M.  All this leaves the operating profit £206M lower at £3.54B.

As far as financial income/costs are concerned, the main driver is the interest on borrowings.  This was a massive £1.1B in interest alone!   This amount was lower by £80M, however, which was the main reason profit after tax was down by just £125M to £2.038B.  Unfortunately a huge actuarial loss on the pension made the total income for the year £1.3B lower at £1.151B. Next year the group is expecting to pay £353M to the UK pension fund and £248M to the US pension fund.  Restructuring Costs included £58M for severance provision & pension curtailment loss for restructuring the US operations; transformation related initiatives of £54M (£103M in 2011) and a credit of £11M for the release of restructuring provisions in the UK recognised in prior years.  Environmental charges include £55M related to specific exposures in the US and are recoverable from customers (last year UK costs of £70M not recoverable).

Gains on disposal of £56M were for Seneca-Upshur, an oil and gas exploration business in the US; £16M for OnStream, a metering business in the UK and £25M for disposals in previous years, representing the release of unutilised provisions.  The £64M impairment of intangibles due to the fact the LIPA management services contract will not be renewed.  Stranded cost recoveries include recovery of some historical investments in generating plants that were divested as part of the power deregulation process in New England and New York in the 1990s – this was £279M in 2012 and it is thought to now be finished with no future recoveries.  There was also a £242M tax credit relating to the change in UK corporation tax rate.

The Balance Sheet:

nationalgridbalance

This year, total assets increased by nearly £1B to £47.335B.  Of that, goodwill accounted for £4.776B and an investment in IT systems caused computer software to increase by £129M to £546M.  The rest of the assets are tangible.  Of these, by far the biggest, accounting for more than half of all assets was plant & machinery – presumably the equipment National Grid uses to transport gas and electricity – this increased by another £1.097B to £28.895B as the group extended their regulated networks (somewhat offset by depreciation and the offloading of the Onstream business).  Assets under construction also increased considerably, as did the value of land and buildings.  Other large increase included derivative financial instruments, up £549M and loans and receivables, which were up £553M.  The loans and receivables are restricted cash balances and relate to collateral placed with counterparties which whom the group entered into a credit support annex to the ISDA Master agreement and pension scheme deficit contributions – if you understand that, you are doing better than me but I guess these are assets not readily usable.   Not all assets were up, however, with the largest fall seen in Available for Sale investments, which were down by more than a billion to £1.675B.  Other large falls were seen in Pension Assets and Trade Receivables, which were down due to warm weather experienced in the US.  The assets and liabilities held for sale relate to the Energy North gas business and the Granite State electricity business in New Hampshire.  Commodity contract assets fell in the US due to a fall in electricity prices. The group is still trying to gain regulatory approval for the disposals.

Total liabilities also increased, up £758M to £38.1B.  The biggest increased here involved derivative financial instruments, whose liabilities increased faster than assets, up £865M to £1.3B and pension obligations, which increased by £514M to £3.088B due to changes in the discount rate following a fall in corporate bond interest rates – pensions seem to be a bit of a thorn in the side of many companies at the moment and this is quite a hefty obligation (albeit backed by a lot of tangible assets).  Also I think worthy of note are the bonds.  National Grid has a massive £18.012B debt in the form of bonds, which seems to be its preferred method of raising cash.  This is an absolutely huge amount of debt which realistically is probably never going to get paid back (well, the individual bonds will, but as a whole I mean).  During the year National Grid also launched its first RPI linked retail bond which attracted a big demand and raised £283M.  It will also be noticed that there are over £1B of provisions, which mainly relate to environmental provisions that represent the estimated restoration and remediation costs for a number of sites.  This is a lot of potential cash outflow…

The Cash Flow Statement:

nationalgridcash

After slight changes in working capital, cash from operations stood at an impressive £4.487B, down £367M from last year.  After tax was paid, this was £630M worse than last year, at £4.228B because the group did not benefit from a one-off tax refund.  So, where does all that cash go?  Most of it goes on capital expenditure, and £3.147B went on the purchase of property, plant and equipment.  We can also see that £203M was spent on computer software as the group overhauls its creaking IT system; £749M was paid in interest on the loans (down by £216M, but it still seems like a lot to be paying out) and just over £1B was paid to the shareholders in dividends.  There were also a few inflows – the largest of which was the net movement in financial investments – this lead to a £553M inflow of cash compared to a £1.577B outflow last year – not too sure what is going on there but it is having a big effect.  National Grid also benefited this year from £365M received by selling a subsidiary.

All this leaves a negligible cash outflow of £43M for the year, £303M better than last year.  However, when you consider that this was only achieved with the help of £553M movement in financial investment and £365M from the sale of a subsidiary, plus another £100M or so in new loans, this does not look quite so healthy under scrutiny.  I find it hard to see going forward how this level of capital expenditure is sustainable in the long term.  Cash flows are generally stable but in the US, timings of customer payments and changes in gas and electricity prices have an effect on the short term cashflow

Profitwise the split is £1.354B UK Transmission, £763M UK Gas Distribution, £1.19B US Regulated and £188M others.  There is still twice as much profit generated from the UK operations than the US business.  Profits were down on last year due to timing differences that benefited last year and two major storms in the US.  National Grid generates value by investing in mainly regulated infrastructure.  It plans to invest over £40B in their regulated networks before 2021.  This investment is key to securing future profits as a lot of their rates are dependent on the amount of capital expenditure they invest.  Ofgem published final proposals for the 2012/13 transmission price control and included real increases in revenues for electricity and gas transmission, reflecting the capital investment made over the period.  This year, the capital investment program was largely driven by improvements to the UK electricity and gas networks.

In the US, cost savings of $200M were achieved through reorganisation and approval was granted to recover a portion of the recent storm costs in their Niagara Mohawk electricity business.  It was announced that National Grid was not selected to continue to manage and operate Long Island’s electricity system beyond the end of 2013.  New rate filings were also submitted for the network.  In the UK, during the severe winter of 2010/11 some gas escapes occurred which resulted in a fine of £4.3M from Ofgem.

UK regulated revenues are linked to inflation so income is up but the group also have inflation linked debt so it is hedged.  National Grid is not really affected by UK economic conditions otherwise.  In the US it is different, as they supply to the end user so are exposed to risk relating to economic conditions and unemployment in particular.

In the UK, energy networks are regulated by Ofgem and they set the amount of revenue that can be earned from the regulated part of the business.  This price includes enough revenue for the group to meet their licence obligations and earn a reasonable return on their investment.  Within this there are financial incentives to Improve the effectiveness of the service, provide quality customer service and invest in the development in the network so as to ensure long term security of supply.  Price controls in the UK exist for their electricity transmission operations (one for transmission ownership and another for system operator), the same for their gas transmission operations, and one for each of the four regional gas distribution networks.  Also there are some price controls governing the LNG storage business and a cap imposed on the domestic metering service.

The transmission and gas distribution price controls expire at the end of March 2013.  There was an extension for the transmission business that included a return of 4.75%.  The prices are determined by taking into account an estimate for operating expenditure, capital expenditure, an allowance for depreciation and an allowed rate of return on capital invested, linked to the value of inflation.  For the transmission businesses, the allowed return is 5.05%, for the gas distribution business it is 4.94%.  Going forward, the pricing structure will change and is revenue will be calculated based on incentives for safety, reliability and customer service.  The other change is that the price controls will cover 8 years as opposed to 5.

In the US, retail rates for energy are regulated by state commissions.  Utility companies submit a rate filing to the governing bodies for a rate change in a litigated environment and can take up to a year for a final decision to be made.  Companies need to prove that the rate change is reasonable but can implement the change before a final decision is made (customer refunds may be needed if the rate change is unsuccessful) and it is often the case that customer bodies will file objections to the increases.  The rates are established based on the cost of providing the energy to the customers and includes operating expenses, depreciation, taxes and a fair return on components of the company’s regulated asset base so that it enables it to attract investors and maintain financial integrity.  The final rate is often based on a test year to establish the costs involved.

National Grid have 5 US electricity rates and 7 US gas rates.  As well as the above, some of the rates allow the group to keep some of the savings achieved through improving efficiency.  If targets relating to service performance are not met, the group could be liable for some fines.  National Grid is responsible for billing customers and bills include a commodity charge for the price of the gas, and charges covering the delivery service.  A substantial amount of the costs are pass-through costs so they can be passed onto the customer (with no profit).

The generation plants in Long Island sell the electricity based on similar regulated rates which end in 2013 – negotiations are underway to set the rates for these plants after this date, however, National Grid have not been selected to run the island’s electricity system beyond this date.

Not including the effects of the US storms, the group were not involved in any reliability issues but they are being investigated over their response to both hurricane Irene and the US snow storms.  The “Smart Grid” is being trialled in Massachusetts that will make capital investment more efficient, improve reliability and assist with storm restoration.

During the period, the group sold Seneca-Upshur, a gas generation and exploration business in the US and OnSteam, a metering business in the UK.   They are attempting to sell Granite State Electric and Energy North in New Hampshire. They are thinking of expanding their Isle of Grain LNG storage business; looking for investors to develop carbon capture technology and are continuing with plans to develop an interconnector between the UK and Belgium in a joint venture with a Belgian transmission system – it is thought that it will enter commercial use by 2018.

There are a number of mechanisms that incentivise National Grid to provide a good service:  transmission network reliability – if targets are achieved, National Grid gain an extra 1% of revenue.  Failure could incur a penalty of up to 1.5%; day ahead gas demand forecast – If targets for the accuracy of the forecast in daily demand on their website, the group will earn and extra £8M.  Penalties can be charged for innacurate forecasts; greenhouse gas emissions – Incentives are earned for below target greenhouse gas emissions.  US plans don’t feature the same variety of incentives as the UK rates but they can earn or lose $4M depending on the reliability of the generation units.

In US, National Grid has moved to a more localised management structure after criticism in order to provide a local face to the business and to more effectively engage with the regulators and customers. This restructuring also seems to have saved some costs by reducing head count.

One example of how Carbon emissions are being reduced is the Grain Heat pipe.  This is a joint venture between National Grid and Eon and is a hot water pipeline that transports surplus heat from the Eon power station to the LNG storage facility.  This heat is used to convert the liquid gas to vapour to get it into the system.  The cooled water is then returned to the power station where it cools the generators.  Other capital expenditure projects include new power cables in London at a cost of about £900M and upgrading the old transmission network in New York state.

Over the year, there was a “small” increase in net debt of £866M! Net debt is expected to continue in line with capital investment.  Next year should see inflationary revenue growth in UK and new rates from some US business.   I find it interesting that the board should consider almost one billion of new debt to be small, but I guess that shows the kind of numbers we are dealing with here.

There has been a £1B JV with Scottish Power to build first subsea electricity link between England and Scotland announced during the period, I am not sure what material impact this will have other than showing that the group are investing in the network..

The UK transmission business recorded profits of £1.4B, up £61M on last year – this increase due to their new regulatory pricing formula, offset by some under recover timing issues and higher employment costs.  The UK Gas Distribution business increased operating profit by £68M to £739M.  Again, revenues increased due to the new pricing formula, and were held back slightly by depreciation and increased contractor costs to make sure they hit performance targets.  In the US regulated business, profits fell by £550M to £1.154B.  The main reasons for this fall were the lack of the over-recovery that occurred last year and the effect of tropical storm Irene and the snow storm, which affected profits by £116M.  Other activities increased operating profit by £215M to £292M.  There were a number of underlying reasons for this increase, there were environmental charges in the previous year that did not reoccur, there were some profitable property sales, the Grain LNG project benefited from the expansion in previous years and there were a number of new metering customer contracts.

The group achieved $200M in annualised cost savings in 2012 and filed new rate cases for their NY and Rhode Island gas and electricity business.  The strategy going forward is to file new rate cases and undergo actions to improve efficiency by integrating new tools such as the new information systems.  They are also working on their response to major weather events, which seem to be a major risk to the US business at the moment.  Other risks include the outcome of the rate case filings and any findings by the audit being undertaken on behalf of NYPSC.  Further environmental regulations may also increase costs in some areas.

So, if you’re still with me, what about National Grid as an investment proposition?  UK revenues seem to be fine, but the reduction in US earnings is a worry, even though it is being put down to bad weather and bad timing.  The figures we are dealing with here are staggering.  There is a net debt of £19.6B, which is a huge amount of money and the interest payments alone would cripple most companies and the gearing here is over 200%!  The cash flow is nominally negative, having benefited from a disposal but most of the cash goes on capital expenditure.

I did find the process of writing this rather tedious and the company in general bores me a bit – the LNG storage is an interesting sideline but the fact remains that most of the income generated by National Grid is regulated and the only way to improve profit is to find some efficiency savings or invest more in the network.  The P/E ratio for what it’s worth is an undemanding 13.3 and the dividend return is 5.2%, which is better than any bank account that you might find.  The one thing that concerns me slightly is the debt.  The business model seems to be to increase net debt in line with capital expenditure – this surely isn’t sustainable in the long term, and I can envisage investors being tapped up for cash at some point.  Tricky one this.  I will continue to hold for the income but may sell if the shares rally through boredom.


Swallowfield Blog – Interim 2013

swallowfieldlogo


Swallowfield have now released their statement for their half year results.

swallowfieldinterimincome


After warnings to the market, this was not totally unexpected.  A massive loss of work from one of their largest clients has caused UK revenue to crash £8.4M to £16.7M.  This is slightly mitigated from increased revenues from the other territories.  Cost of sales also fell, but by not so much – they were down £4.7M to £23.5M.  After slightly reduced commercial costs and a one-off charge of £175K relating to restructuring and cost cutting, the operating loss was £700K, £1.4M worse than last year.

Due to the loss, the group achieved a tax rebate and the loss for the period was £606K, £1.1M worse than last year.  It is disappointing to see the group making a loss for the half year and the loss of business is a big problem but I do think a loss of £606K is not that bad going considering the 34% reduction in UK revenue.

swallowfieldinterimassets


There is not a huge amount of change here.  As would be expected given the loss of business, the largest reduction in the assets are for trade and receivables – down £3.4M to £10.2M.  The other big reduction is the £662K fall in cash reserves, which indicates a negative cash flow.  That held for sale warehouse seems to have been held for sale for some time now.  In liabilities, trade and payables have also fallen, down by £2.7M to £15M.  (is it normal for payables to be higher than receivables?  Doesn’t seem right…  I suppose we have the value of inventories to take into account too).  Overall liabilities are down nearly £3M at £18.1M.  They have not reduced by as much as the assets, though, so net tangible assets are £833K lower at £12.7M.

swallowfieldinterimcash


As we have already seen, the crash in revenues has caused the cash from operations, after movements in working capital, to be a negative £283K.  After tax and finance charges, the cash outflow is £470K.  There is a much reduced capital expenditure and a net £765K of new borrowings.  However, after dividends are paid, the outcome is still a net cash outflow of£662K for the half year, compared to a very similar £569K in the same period of last year.  However, taken in context of the net £765K of new borrowings compared to the net payback last half year of £1.4M, this is a weak cash flow.

In this period, the group had three customers that exceeded 10% of total revenues (12.5%, 11.7% and 10.2%) compared to two customers accounting for 29% and 18%.

It was announced prior to these results that Ian Mackinnon, the CEO for 13 years has decided to resign.  It has been a difficult couple of years at a board level with the largest shareholders looking to place their own people in roles at the board.  No doubt it was this pressure combined with the loss of an important contract as reported previously that led to his decision.  In the short term, this will lead to some volatility for the group.

During the downturn, the group has seen its clients become more cautious with new launches and demand in general has been somewhat supressed. This has led to at least one of their important clients to bring some of the work that Swallowfield used to do in house in order to achieve greater efficiencies, and presumably, greater control.  This process has been dealt with quite a lot of spin by Swallowfield and is being called “customer rebalancing” as if it is something that they have a great deal of control over.

Much has been made of the fact that this time last year, their top two customers made up 47% of total revenues whereas this year, the top two make up just 24%. Whilst this diversification is good going forward, I find the positive spin put on this by the board a bit worrying – the reason the top two clients account for much less percentage of the total revenue is because they have lost some business with them – this is not a good thing!  Also, a big deal is made out of the fact that export percentage is increasing and now accounts for 35% of revenues compared to 21% last year.  Again, it is great that exports are increasing (and they are) and exports are very much an important part of diversification going forward but comparing them to the proportions last year is not very helpful as if business was lost with a large UK client, of course the proportion of exports will be up.

Pleasingly the Chinese investment has increased in value and this must be viewed as an important asset going forward.  In other areas abroad, both the US and the French offices have won new contracts and business, which is an exciting development as these areas have struggled somewhat in the past.

There has been a decent control of costs, with the restructuring that has taken place and the group believe that the worst of the raw material inflation is over and there is an announcement that new contracts have been secured, which will start to take effect in the second half of the year (if this is the case, then the results for the full year should be a bit better).  Going forward, there is not anticipated to be any more “customer Rebalancing” and there do seem to be a number of product launches and new business wins that will go some way to mitigate the loss of the business in this past half year so although this is a pretty poor set of results, there seems to be a bit of optimism.

So, we have seen UK revenues collapse, leading to a £606K loss in the half year and there was a negative cash flow even with new borrowing coming on line.  However, the increase in overseas revenue is pleasing to see.  Net debt for the year increased by £1.4M in the period and remarkably the interim dividend remains unchanged, which means that at the current share price the shares are yielding 6.8%.  I do feel, however, that there are too many warning signs here.  There is definite evidence of Swallowfield’s clients taking business in-house, the long standing CEO has resigned, there is s worrying trend of what I believe to be over-optimism in the update and it will take a huge amount of new business to counteract the effect of the lost contract(s).  For now, I have sold out of these shares.


Tristel Blog – Interim 2013

tristellogo


Tristel have now released their results for the half year.

tristelinterimincome


This is not a particularly pretty sight.  Revenues for the largest two segments are down £764K between them, and the new contamination control segment increased by £105K but there has been quite a shift from UK revenues to those of the rest of the world.  When combined with flat costs of sales this meant that the gross profit was £654K lower at £2.8M.  We also see that depreciation is up £147K to £576K but the other admin expenses of £2.8M effectively cancel out the gross profit.  On top of this, there are also £2M of (mostly non-cash) exceptional items.  Negligible finance costs and income mean that the loss before tax is £2.7M.  Due to the loss, the group received a higher tax rebate than last year to leave the loss for the year standing at £1.9M.  Not altogether unexpected but disappointing nonetheless.

The exceptional items were made up of £81K in redundancies, £45K of impairment of investments, £78K in goodwill impairment,£103K in impairment of property, plant & equipment, £212K in provisions against bad debts and £385K in provisions against obsolete inventory.  The bulk of the value, however, came from the impairment of other intangibles of £1.1M.  At least most of these are non-cash items.

tristelinterimassets


We can see the effect of the non-cash write offs here as intangible assets are down by £1.3M.  The other major difference here is the reduction of cash to a tune of £705K to leave nothing left!  This means that total tangible assets were £1M lower at £6.1M.  In the liabilities we can see that the tax liability has reduced by £100K and the payables are down by £461K, which is slightly counteracted by a £185K increase in current bank loans.  Overall the net tangible assets are £651K lower at just £4.1M.

The impairment of the intangible assets involved a charge of nearly £1M for delivery systems due to a decline in future revenues predicted and a £134K charge for products in development.

tristelinterimcashflow


As we have seen the reduced revenues have caused the cash loss from operations (even after favourable movements in inventory and receivables) to be £450K. For some reason the group did not receive any tax rebates in this half year but did spend less on capital expenditure.  There was also a total of £140K paid out in dividends that the group could ill afford.  Overall, the cash outflow for the six months was £889K.

There has been a bit of progress made during the half year and the Wipe Systems have been approved for sale in China.  Sales in Germany and Australia have seen big hikes, in contrast to sales in the UK and the Amistel range (vet disinfectants) has been sold to into CSV veterinary surgeries in this country, which is pleasing given that Tristel are now marketing these themselves.

The main issue this half year has been the decline in sales of the multi-channeled endoscopy products at a faster rate than was expected – this has led to both the reduction in revenues and the subsequent one-off costs.  The falls can be partly attributed to new NHS guidelines that enable hospitals to use the washing machine’s own brand disinfectants, which evidently most hospitals have chosen to do.  The future rests on the group’s ability to push its other, newer products which include the wipe and surface decontaminating systems which have recently been granted a licence for use in China.  The other great hope is the vet infection prevention products and these actually seem to be doing OK following Tristel’s termination of the agreement with Medichem.

Overall then, this is not a good update.  The most worrying issue are the collapsing revenues, but it is rather good to see diversification away from the UK.  The £1.9M after tax (rebate) loss is mostly made up of exceptional items but more of an issue is the negative cash flow, which at £889K for the half year, is quite a loss for a company of Tristel’s size and puts it into a net debt position.  The dividend has been cut, but after a fall in the share price the full year yield is still an unexciting 2%.  Going forward, management expect the group to be cash generative in the second half but I have fallen for their hype before so I will wait and see what happens – after buying a few more since the final results, I will now hold and wait.

On the 22nd July, Tristel released a trading statement covering the whole year.  The restructuring and sales growth returned them to profit in the second half after the loss making first half and the full year profit before exceptionals is now expected to be £300K.  Also there was some good news regarding the cash flow.  The group achieved a £500K cash in flow in the second half, compared to the £400K outflow in the first half of the year.  They seem to have done particularly well in Human Healthcare where the instrument wipes and surface disinfectants gained increased acceptance both in the UK and overseas.  The offices in New Zealand and Germany were profitable during the period and although the Chinese office has some way to go, the performance in the second half was encouraging.  Less was said about the animal healthcare and contamination control sectors but overall this seems much better than the results in the first half.

Ricardo Blog – Interim 2013

ricardologo

Ricardo have now released their interim results for 2013.

ricardoincomeinterim


Revenues from both technical consulting (boosted by the acquired business) and performance products were on the up but with a similar increase in the cost of sales, Gross Profit was just £800K higher at £39.9M for the half year.  Administrative expenses were £1.2M higher which meant that the operating profit was actually £300K less than last year.  A slight increase in finance costs and tax drove the profit for the half year £500K lower to £4.9M.  This suggests a bedding in period for the acquisition. The result is dragged down somewhat by actuarial movements in the pension scheme (albeit by less than the same period of last year) so the total income for the six months was £1.6M.

Income in the UK was up, boosted by the acquisition and strong passenger car and performance vehicle sector performance.  Revenues in the US decreased slightly but revenues in Germany collapsed due to a key client taking their requirements in-house.  Performance product revenues were driven by increased motorsport activity, delivery of defence vehicles and improved efficiency.

ricardobalanceinterim


Starting with the assets, although they increased by £15.6M, that was driven completely by the increase in Goodwill (£9.4M) and other intangible assets (£9.3M) which is clearly related to the acquisition.  Pretty much all the other main assets fell over the first 6 months of the year.  The Goodwill asset was reviewed after the German segment lost a key client but it was determined that no impairment was required (£12.7M of that goodwill was in respect of the German Technical Consulting business, so quite a chunk).

Most of the liabilities increased, driven by a new bank loan of £10M and £6.2M more in trade and payables.  Added to a small increase in provisions, total liabilities were up by £18.3M.  This all lead to net assets decreasing by £2.7M to £87.1M and given the increases in assets were intangible, net tangible assets fell £21.4M to £46.3M.  This is still a healthy level given the relatively small level of debt but it is a large undesirable movement.  The pension scheme deficit is becoming a bit of a worry, however, and now stands at £22.3M (up from £20.4M at the end of the year).  The increase is put down to reduction in the discount rate and higher expected inflation.

ricardocashinterim


Before changes in working capital, the cash flow of £11M for the half year was at a similar level to that of the same period of last year.  A tighter control on receivables helped the cash from operations up £1.9M on last year to £12.4M.  There was a small amount paid out on the pension scheme and a negligible tax payment (very low, even considering the tax breaks they get from R&D) but the main point here is the £18M paid out to acquire AEA.  There was an extra £3.7M received from the sale and leaseback of the German properties  and slightly lower capital expenditure than last time plus a net £8.2M of new borrowing to give a fairly decent cash flow before increased dividends of £4.5M were paid out.

This all leaves the bottom line of a £2.4M outflow of cash.  When it is considered that during this time, £18M was paid out for the acquisition but only £8.2M in new borrowings and £3.7M in one off receipts (£11.9M all together) had it not been for the acquisition, there would have been a strong positive cash flow here.

The profitability of Technical consulting was down slightly, while performance products have increased profits.  Geographically, UK, most of Europe, Japan and Malaysia improved but in Germany, China and Other Asia sales have fallen.  There was a major contract loss in Germany but it is a shame to see the fast growing Asian economies not doing so well for Ricardo.   US performance should improve due to the structure of the order book.  The order book looks fairly robust, albeit having been boosted by the acquisition, at £136M compared to £107M at the end of last year.

The group is in a position of net debt, which is quite unusual in recent years and suffered a swing of £10.6M, driven by the acquisition.  At £2.7M, however, it is still very low and the borrowing facilities of £35M still look very safe.  That purchase of AEA included £9.3M of Goodwill and £8.5M of other intangibles so there were no real assets to speak of.

Long term, continued focus on emissions regulation and fuel efficiency is good news for Ricardo, given their expertise in those areas.  The continuing threats of asymmetric warfare are also giving opportunities for the group.  Likewise, renewable energy is another area that Ricardo are active in, which is demonstrated by their work with David Brown Gear Systems and Samsung in designing a new gearbox for a new range of offshore wind turbines.

Ricardo have experienced good levels of activity in the automotive markets of China, Korea, Japan, UK and US with growth rates particularly strong in emerging economics where Ricardo is providing solutions to improve fuel economy and reduce emissions and they have secured a number of significant programmes across their main geographical markets.  The group is achieving good levels of business in the Motorcycle industry with their big European client and new clients in Japan and China.  The motorsport business has continued the supply of engines and transmission systems to McLaren and continues to provide transmission systems for the Japanese Super GT cars, along with transmission systems for an F1 team.

Agricultural and industrial vehicles have been doing well in Japan with relationships emerging with new companies in China, and starter orders hopefully the sign of more business there.  The group has won some work in the industrial vehicles sector to develop a wide body version of TaxiBot with Israeli Aerospace Industries that allows planes to taxi under pilot control without the use of jet engines, thereby saving considerable fuel usage.  In the Rail sector, a number of new customers have been attracted and there has been interest in developing Natural Gas as a locomotive fuel, a project on which Ricardo has helped a Railroad company in North America.

Further orders have also been received in the power generation sector, particularly in renewables with projects in both offshore and onshore wind turbines, tidal stream and solar power.  They have also been active in developing energy storage solutions.  In marine, ship makers are not looking to make huge investments so focus has remained on improving the efficiencies of current engines, including the integration of Gas powered vessels.  The Government sector has been challenging, given the cutbacks that have been taking place and the UK public sector remains the largest market.

In performance products, demand for transmissions remains strong across many racing series and over 2,400 engines have now been delivered to McLaren.  Rail transmission production has now started and a follow on order for these is expected that will take production through the next two years.  Similarly, a new follow on order from Bugatti will take production of that transmission through to 2014 and a follow on order from the MoD for more Foxhound vehicles should keep the facility busy.

So, for the last six months we have seen revenues up, being particularly strong in the UK but counteracted by the loss of a client in Germany.  Costs have increased to a greater degree, however, and profits were £500K lower at £4.9M.  Net tangible assets fell £21M to £46.3M because the acquired company had no tangible assets to speak of and there was a negative cash flow of £2.4M.  However, when it is noted that the £18M acquisition was only partially funded by new borrowing and one off receipts following the sale of the German offices, the cash flow looks fairly good.  The share is currently yielding a 3.2% return, which is not too bad.

Overall then, this half year has been characterised by the acquisition and I think it is too soon to see how that will affect results for the full year.  Profits are down slightly and the loss of the German client is a concern but the cash flow was fairly decent considering and going forward Ricardo should be able to benefit from increasing emissions regulation around the world.  I will continue to hold.

On 16th May, Ricardo released an interim management statement.  Overall it seemed to be very positive as customer activity has improved leading to a good pipeline across the group and the order book at the end of April stood at £130M.  Revenue for the 8 months was up by 15% (3% discounting the influence of the acquisition).  Also very pleasing to hear is that the German and US business are recovering after a difficult period.

Technical consulting levels have increased, driven by a broad range of projects from car manufacturers with work from the US, UK, Russia and the Far East.  Demand in continental Europe remained subdued but Japan performed well.  Outside the car market, new projects were started for power generation and rail applications, an example being the group advising Canadian National Railways on the potential use of Natural gas as a fuel for their locomotives.

Ricardo-AEA seems to be bedding in well and is in line with expectations.  New orders have included a three year contract to monitor air quality in Riyadh and a contract to provide advice to Scottish organisations on how to reduce energy, water and material costs.  The performance products segment continued to perform well with a new order for 76 more Foxhound vehicles and the continued supply of engines and components to motorsport companies and a new programme for the supply of transmissions for the Porsche cup.

Cash generation was strong, with a net cash position at the end of April of £11.3M.  Overall, the business seems to be progressing well and there has been a pick up of activity outside of Europe and I believe this to be quite a positive update. The share price has picked up recently though and it is not all that cheap.  I still consider Ricardo to be a good investment in the medium term though and may look at adding some more.

On 16th July, Ricardo released a trading update.  It was mentioned that new contracts have been won in the car, defence, power generation and marine engine sectors and customer activity has been positive.  Revenue levels the the whole year should be above that of last year, even when discounting the acquisition of Ricardo-AEA and profit performance should be above market expectations.  There has been good cash generation which led to a net cash balance similar to the prior year.  Remarkable when the year included the £18M purchase of AEA.  All in all this a very upbeat statement and I think these shares are worthy of a buy.

Dechra Pharmaceuticals Blog – Interim 2013

Dechra have now released their half year results for the year ending 2013.  I will start with the income statement.

dechrainterimprofit


Starting with the revenue, we see that this is up across the board and in particular, revenues in Europe have increased considerably due to the acquisition of Eurovet.  Cost of sales are also up, but to a lesser degree so gross profit is £16.3M higher at £62.8M.  Admin expenses are also up considerably and there is a big amortisation charge relating to the acquired business.  This doesn’t really concern me much as it is a non-cash charge.  The operating profit is £15.1M, over £4M up on the same period of last year.   This increase is eroded somewhat by some financial costs, the largest of which are financial liabilities at amortised cost – not totally sure what that relates to.  There was also a higher tax bill which left the profit for the half year just under £2M higher at £8.6M.

There were some very good currency translations on foreign operations, which left the total income for the half year nearly £10M higher at £13M.  Even discounting these exchange differences, I think this is a decent performance.

The assets:

dechrainterimassets


From the position at the end of last year we can see that assets have reduced by £16.7M.  This is predominantly down to a £15.8M reduction in cash, and partly due to a £3M reduction in intangibles, presumably relating to the goodwill impairment.  Small increases in receivables and inventories do little to mitigate this.

Liabilities are also down, however, as a £12.1M reduction in payables and an £8.2M reduction in deferred consideration (presumably as some has now been paid – this will be shown in the cash flow statement below).  Overall then, this means that net tangible assets have improved by nearly £10M to leave them at -£62.4M.

The cash flow statement:

dechrainterimcashflow


From operations the group achieved a cash flow of £25.9M.  Once the movement in working capital had been taken into account, however, this figure was only £11.6M as the group seem to be carrying a lot less in payables than they were, apparently some of this was due to supplier shut downs over Christmas.  Interest of £2.7M and tax of £5.1M then wiped out most of the rest of the cash to leave only £3.8M before the capital expenditure of £3.2M is taken account of.  The proceeds from new share capital counteracted the repayment of loans but the large headline negative cashflow seen here was caused by a £10.1M payment relating to acquisitions.  This was mostly paid due to exceeding $20M income in 12 months from the acquisition of Dermapet as we were made aware of by the statement earlier in the year.  There is the potential for $6M more in deferred and contingent consideration being paid.  There was also a £7.4M payment for dividends.

I am not sure how useful it is to compare the cash flow for just half a year but clearly the £16M of cash lost is not sustainable.  It seems to have been caused by the Dechra paying some of its pending payables and that £10M charge for acquisitions.  If payables remained flat and this charge was not incurred then there would be a positive cash flow here.  So, not great but hopefully this is a one-off.

By operating profit, the European Pharmaceuticals segment is the most important, but all segments grew profits on last year.  The main story operationally is the integration of the Eurovet purchase and savings have already been made by selling products through the new German subsidiary created in the takeover.

Not counting the Eurovet contribution, European sales were relatively flat (but 8% higher at constant currencies).  The lack of growth has been put down to less sales due to the old distribution network running down stocks before being transferred to the new subsidiaries.  This effect should be reversed in the second half of the year.  Own brand pharmaceuticals have been doing well and grew by over 10%.  There is a danger going forward that antibiotic usage may be more heavily controlled in Europe due to resistant strains of bacteria becoming more common.  Pet diets also did well and were up by more than 6%.

Dechra have made the decision to close the manufacturing facility in Denmark and the licenced pharmaceuticals will now be produced in Skipton in the UK.  The Skipton site is already doing well as contract manufacturing increased nearly 16% and a strong order book was reported.  Service revenues increased by 5% but pressure remains on margins due to the continuing necessity to discount products.  The laboratories increased revenues by 8%.

In the US, progress has been OK, with revenues up 9% at constant currency, although they have experienced supply problems with their in-licensed dermatological range.  The veterinary licensed ophthalmic products are being transferred to a new supplier and will be relaunched this year.

There have been a number of successful registrations over the half year, including Methoxasol which is an antimicrobial for swine and poultry in the EU; Soludox has now been authorised for use with Turkeys; Comfortan can now be used for cats; Libromide has been extended into France, Austria, Portugal and Switzerland; and Felimazole has been approved for use in Australia.

During the half year, the group has completed a licencing and supply agreement for a branded veterinary generic pharmaceutical product in the US which will be their first entry into this market.  Dechra have already paid $1.5M for this and a potential $5M could be paid in the future.  They have also agreed a licencing agreement for SCY-641, which is used for the treatment of Canine Keratoconjunctivitis.  Again, a fee has been paid (not disclosed) and more could follow.

Net debt increased by £15.3M to £102M.  Net assets £160.5M comprising mostly of goodwill.  Bank facilities are currently at £130M which at this rate doesn’t give a huge amount of head room.

So, overall this is a fairly decent update.  Revenues are up across the board, but mainly due to the extra sales bought in by the Eurovet acquisition.  The profit for the half year was £2M higher at £8.6M.  Net assets are up due to the reduction in trade and payables, and the payment of the contingent consideration but net tangible assets are still a negative reflecting the large amount of intangibles on the books.  The lack of debt headroom is a worry and the net debt of over £100M is also a bit of a concern given the lack of tangible assets and I hope that they haven’t overextended themselves with these recent large purchases.

Going forward, trading continues to be robust but the regulatory pressure on vets to reduce use of antibiotics is being monitored and in January the performance of the Services segment was poor due to bad weather affecting footfall in vet surgeries.  Operationally, this half was all about the continuing Eurovet integration and things seem to be going fairly well in this regard, though the warning about the low vet footfall in January may be a slight worry.  It is pleasing to see Dechra entering new markets with the branded generic pharmaceuticals in the US.

Cash flow this half year was strongly negative but this was entirely due to the movements in working capital and the payment of the contingent consideration relating to the Dermapet takeover – there is not much left to pay with regards to that now and these issues can be considered one-off cash costs.   The dividend here is nothing to write home about and is currently yielding 1.8%.  So, there are some concerns here (particularly about the large debt and the worry over the use of antibiotics) but overall I see these shares as continuing to be worth holding.

On 8th May, Dechra released an interim statement covering Q3 2013.  Overall revenue for the quarter was up nearly 15% on the same period of last year and was 18% up during the first three quarters.  The best performing sector was European Pharmaceuticals that due to the Eurovet acquisition was up nearly 70% in the quarter and a similar amount for the nine months.  On a like for like basis, companion animal products were up 11%, farm animal products up 1% and pet diets grew by 2% for the first nine months of the year.

US Pharmaceuticals did not fare so well, in Q3, revenues crashed by over 14% over last year but were roughly level in the nine month period.  This has been blamed on problems with a third party manufacturer, which is very disappointing.  Revenue in the services sector also declined, down by 2.5% but for the nine month period, revenue was up nearly 3%.  This is apparently due to significantly reduced footfall through vet practices, which in turn is blamed on the weather!

Overall this is a disappointing update, all sectors seem to have slowed in the third quarter and the supplier issues in the US is of particular concern.  The fact that reduced service revenues are blamed on the weather also seems a bit week to me. The performance in April is apparently much better, however, so I still rate these as a hold (just about).

On 10th July, Dechra released a trading update covering the whole year.  Overall, group revenues were up 19% but performance was hampered by supply issues in the US and adverse weather in Europe.  European revenues increased by 65%, but most of this increase was due to the contribution from Eurovet.  On a like for like basis, revenues were up 5% despite being hampered by a prolonged winter period.  Both Pharmaceuticals and Diets improved.  In the US, revenues increased by a modest 3% due to third party supply issues that still do not seem to be resolved.  Services revenue grew by 6% year n year and the segment secured some important new contracts, including agreements with internet pharmacies.  The net debt position was improved in the second half of the year.  Not a bad update by any means but the fact that the supply issues in the US are not yet resolved are cause for some concern.

On the same day, Dechra announced their intention to sell the National Vet Services, Dechra Lab Services and Dechra Speciality Labs to Patterson Inc of America for a cash total of £87.5M.  The reasons given by the board are that it enables Dechra to focus on its key own branded vet products business which is higher margin than the service business and that there are no material synergies between the Pharmaceuticals segment and the Services segment.  The cash receipt will go towards clearing some of the debt, which I definitely approve of.

The Services group basically includes the labs and the distribution service to vet practices and it generates a lot of revenue for the group, but only about £11M of profit during the year.  The services segment has £59M of net assets, so when combing this with the £11M of profit each year, I do think that £87.5M is a little cheap.  It will obviously reduce profits and increase costs (as Dechra will still have to distribute its products) in the short term and it means that Patterson will have a foothold in the UK market.  What their long term intentions are, I’m not sure but it worries me slightly.

Overall then, I do think that Dechra are running on too much debt and this is probably the best way of gaining the cash to pay that down.  I have some concerns that the disposal is taking place at too low a price and it will hit profits in the short term.

Compass Blog – FY 2012

Compass House, Guildford Street, Chertsey, Surrey, KT16 9BQ

CompassGrouplogo


Compass is a large FTSE 100 company who provide culinary and maintenance outsourcing services to companies and institutions in various sectors.  Less than half of the food service market is currently outsourced and Compass sees this as an opportunity to target.  Most of the new business Compass achieves come from companies who have outsourced these services for the first time as opposed to Compass’ direct competitors.  The bulk of the work is in food outsourcing, but the group also offer cleaning, reception and light building maintenance.   It is active in the following sectors:

Business & Industry – this is the most important source of revenue for Compass, accounting for 42% of revenues in 2012.  They provide food and other services to offices and factories.

Education – Accounting for 16% of sales, Compass provides meals for schools and colleges.

Healthcare & Seniors – Accounting for 19% of revenue, Compass provides food and other services to hospitals and offer care services to residential homes and home meal delivery services.

Sports & Leisure – This sector is the smallest, only accounting for 10% of revenue.  Compass provides services to stadiums, exhibition centres, visitor attractions and major events.

Defence, Offshore and Remote – This is 13% of group revenues and involves providing food and support services to the oil & gas, mining and construction industries.  Services are also supplied to the defence sector under this segment.

Here is the income statement.

compassincome


Revenue is up across the board with healthcare revenue showing the largest percentage increase, up £338M to £3.2B.  We also see that costs have increased at a greater level, however.  Cost of raw materials is up substantially but the biggest increases come in Employee costs, up £658M to £7.8B and “Other Expenses” which are up a hefty £293M to £2.4B.  This is a big increase, so I would like to know what is included.  Due to these increased expenses, operating profit was £160M less at £856M.  The increase in finance costs relates to the pension deficit, costs relating to the share buyback and the raising of the new debt in the US private placements.  A similar amount expected in 2013 with another pension deficit charge and another share buyback.

We see that there is a one-off gain of £23M (net £13M after tax) on the disposal of the US corrections business but most of this is non-cash as it is due to the release of provisions allocated against this business.  Last year there was a similar level of one-off gains, however, as £16M was earned on acquisitions – this was a non cash gain due to the re-rating of the value of the current investment in the JV (Sofra Yemek Uretim).  The major financing charge is the interest on loans, at £77M, which was £17M higher than last year.  All this means that the profit for the year before tax and the profit on discontinues operations was £789M, down by £169M.  A lower tax charge, however, was not entirely counteracted by the loss of the profit from those discontinued ops received in 2011 and profit for the year was £123M less at £611M.

There was a bit actuarial loss on the pension scheme and this, combined with negative differences in currency translation mean that the total income for the year was a whopping £316M lower at £433M. On the surface this performance looks a little disappointing.

compassassets


Starting with the assets, we can see that total assets are down by £180M to £9.2B.  This fall is almost entirely due to the reduction in cash of £382M.  The largest asset base is Goodwill, at over £4B.  This is a sign that Compass has been making quite a lot of acquisitions in the past and it always makes me a little nervous when the largest asset is Goodwill, due to its intangible nature.   Most other assets have shown modest increases on last year.  Trade receivables are very diverse so is not a huge risk – receivable days are now 46 from 48.  There are still £437M overdue though and this figure includes a £33M deduction relating to European exceptional non-payment of receivables.  New controls have now been introduced to ensure the quality of new and existing business so going forward this should not happen again.

Liabilities have also decreased, but only by £82M.  One good point here is that we see a complete elimination of £294M of current bank loans, partially replaced by non-current bonds.  There seems to be a reduction in tax liabilities but there are a number of large increases of certain liabilities that I think should be flagged up.  First we have a £164M increase in provisions, up to £603M.  This seems like a lot to me and the increase was to do with the restructuring of the European business and relates to loss making contracts and the non-recovery of some debts.  There are also provisions for insurance policies and environmental provisions, which are set aside to make sure the group makes its commitment to have a low environmental impact and relates to operating sites.  Also we see a £75M increase in deferred income, up to £281M which also seems like a big increase.   Finally there is a £69M increase in pension obligations which seems to be a bit of an issue for a number of companies at the moment.

All the above means that net tangible assets are £324M lower, at -£1.6B.  The reduction in some of the debt is pleasing but the increase in some of the liabilities and the negative tangible asset base is something that I will keep an eye on.  Compass does not seem to have much in the way of traditional bank loans but instead have private placements and Eurobonds.  I am not sure of the advantage of these over more traditional fund raising methods, the interest rates seem to be between 3% and 7.5%.

compasscashflow


So, there seems to be a bit of a negative cash flow going on here – the group lost £368M during 2012, a whole £835M worse than last year.  So what happened?  We see that cash from operations was pretty good, after movements in working capital there was a cash inflow of £1.4B.  After tax, and an increased amount of interest, there was still £1B of cash coming into the company.  Some of that tax charge includes a £31M cash outflow to settle historic tax issues. The group made a one-off £55M from the sale of subsidiaries, but spent £221M on new acquisitions (considerably less than last year).  Over £200M was spent on new property and equipment, and another £150M on intangible assets.  The big difference over last year was the borrowings, £133M was paid back on loans, compared to new borrowings of £610M.   The group also spent £356M on a share buy-back scheme and £384M was paid out in dividends.

So, were it not for the repayment of the loans (a lot more are still outstanding in the form of bonds) and the share buyback, the cash flow here would actually be positive.  It isn’t massively positive but it is certainly not as bad as it first appears.  I am not sure of the wisdom of buying their own shares – there is not really the free  cash flow to do it, and if there was I would prefer some sort of cash return to shareholders but not much I can do about that!  Due to the restructuring of the European business, there was a £20M cash charge and another £80M to be spent this year to cut costs and improve efficiencies.

There was a £54M outflow on pensions relating to payments agreed with the trustees to reduce deficits on the scheme.  These regular payments are expected to continue going forward. The pension fund deficit now stands at £361M and £75M will be paid in first half of 2013.

Compass divides its regions into three segments: North America, Europe & Japan and Fast Growing and Emerging.  The fortunes of the different regions have been contrasting.  In North America, the largest by revenue (44%), business has been good and sales have grown organically by 8%.  In Europe & Japan (37% of revenues), trading conditions have been difficult due to the well documented economic woes in the EU but Japan has mitigated this somewhat.  Fast Growing (19% of revenues), like it says on the tin, grew sales by 12%. Therefore the group seems to have done well in North America and Emerging Markets but is being pegged back by the situation in Europe.  There have been some announcements to improve efficiency in Europe for the long term.

Compass seems able to keep hold of their clients well and retention rates are over 94%, and those have seen some softening as companies in Southern Europe close.  The like for like revenue growth seen is primarily due to price increases driven by food inflation that has been passed on to clients.  Like for like volume remained flat with a positive trend in Emerging countries contrasting to a flat trend in North America and a decrease in Europe.   Key emerging markets are Australia, Brazil and Turkey with China and India also being targeted.  North America is still the most important region, however.

North America accounts for the largest amount of revenue.  By sector, North America is made up of 31% Business & Industry; 27% Healthcare & Seniors; 24% Education; 13% Sports & Leisure and 5% Defence, Offshore & Remote.  This year successes have included a 10 year contract to provide food and support services to the Texas A&M university system, which is the 6th largest educational institution in the US.  Another notable contract win has been the Ascension Health contract.

In Business and Industry, contract wins at Adobe and IDC Research with contract retentions for Wal Mart and Proctor and Gamble have driven an increase in profit.  The Healthcare sector delivered strong growth in profit with new contracts for Ascension, Cathedral Village Retirement community in Philadelphia to deliver a food service and the Victoria general and Royal Jubilee hospitals in Canada.  Additionally, a contract to deliver support services to the University of Kentucky hospital was won.  Revenues were up in the Education sector with new contracts for the Texas A&M university, University of Illinois, and retention of the Simon Fraser University contract in Canada.  Given the size of the new contracts, some capital expenditure is planned to upgrade existing facilities.  In Sports and Leisure, new contracts included the Barclays Centre and the BBCA Compass stadium.  The group also has contracts supplying businesses in Alaska, Canada and the Gulf of Mexico.

Europe and Japan account for the second highest amount of revenue and it is fair to say things have been difficult here.  By sector, the revenue percentages are Business & Industry 56%; Healthcare & Seniors 15%; Education 12%; Sports & Leisure 11% and Defence, Offshore & Remote 6%.  Organic revenue in the region declined by 0.7% due to the worsening conditions in Southern Europe.

In the Nordics, the group won a contract with Scania; in Netherlands a contract win was recorded for UWV, in France a contract was won with Cash Nanterre (a hospital) and in Spain a food contract was won with Sanitas Group, a private healthcare insurance group and the multiservice contract with Pfizer has been extended.  In the Nordics and Germany volumes were flat and in France and UK conditions deteriorated somewhat while in Italy, Spain and Portugal volumes decreased by about 5%.  Trading conditions in Japan improved as the country recovered after the Earthquake and Tsunami last year.  The group incurred a charge of £295M to address the poor conditions in Southern Europe with £100M earmarked in improving efficiencies and £195M for “further actions”.  Not sure what this is for but it will apparently result in a £20M improvement in the profit performance next year.

The Fast Growing and Emerging sectors are still the smallest by revenues but they are becoming more important.  In 2012, the revenue split was Business & Industry 40%, Defence Offshore & Remote 44% (probably mostly Australia); Healthcare 8%; Education 5% and Sports & Leisure 3%.

An important country for Compass is Australia, one of the top 5 by revenue.  The most important part of the Australian operation is the running of camps that provide transient accommodation for the workforces of oil, gas and ore miners.  Food and living services are provided, along with maintenance of the facilities to house the workers.  This year has seen double digit organic growth in the country so it is continuing to contribute well – hopefully a Chinese slowdown won’t affect them too much.  Brazil is another country that saw double digit organic growth.  A new contract has been won at the Mendes Junior Holcim project and the food service contract with ThyssenKrupp was maintained.  Elsewhere in Latin America, Compass extended a contract with Sanofi Aventis and operated the Pan American games.  In Argentina, a new food service contract with Peugeot and a multi service contract with Petrolera was achieved. In Colombia, a contract with AngloGold has been won.

Turkey is a good prospect, and Compass has been spending money on acquisitions here.  New contracts in the country have been won with Universal Hospitals, Goodyear and British American Tobacco.  South Africa has also been strengthened with an acquisition and in Australia new contracts have been won with Xstrata Copper, BHP Billiton and Goldfields.  In China, new contracts were won with Caterpillar and an extension in the contract with MTR Corp.  Finally, in India new contracts include those with Medanta (hospitals) and Damiler India.

Potentially, there are a number of issues that could affect Compass. The Business & Industry and Sports & Leisure segments (about 50% of the business) are susceptible to economic downturns, as has been seen in Europe.  Another issue facing Compass is food inflation but this can generally be passed on to customers as it is often included in the contracts.  The pension scheme is another potential source of problems and is causing quite a drain on finances but it is now closed to new entrants.  Currency changes can also cause problems and the strengthening of Sterling has been a bit of an issue, particularly against the Euro and Brazilian Real and had the effect of decreasing reported revenue by just over 1%.

Going forward, it is expected that the profit from the 2012 acquisitions will be offset by the lost profit from the disposal of the US Corrections business. It is not clear to me why this business was sold, other than the stated desire to concentrate on core businesses. After the balance sheet, the group purchased Crown Camp Services, a food and support services company in the Oil and Gas industry; and Nova Services, a company that provides food and support services to the business and healthcare sectors in Canada.  Compass will continue to look for new acquisitions.

So, we have seen that revenues are up, with healthcare in particular doing well but within this we see a difference within the regions, with emerging markets doing well, North America holding its own and Europe contracting.  Costs have also increased, mainly due to increased wages and food inflation but this means that the profit for the year was a whole £123M lower at £611M.  The balance sheet is dominated by the Goodwill which means there is a negative tangible asset base, which widened by £324M to a negative £1.6B, which I can’t help but feel a little concerned about.

There was a big outflow of cash, with the group losing £368M over the year, but when the £356M spent on the share buyback scheme is taken into account, this looks rather more healthy.  It does, however, mean that net debt rests at almost £1B.  There is another £400M earmarked for the share buyback in 2013, which I am not 100% happy about.

Looking forward, steps are being taken to address the issues in Southern Europe and as long as North America holds its own, prospects look pretty good.  Food inflation is also  worry but Compass seems to be pretty good at passing this on to customers.  The dividend yield on the current share price is an unexciting but decent 2.7% (maybe some of that cash the company doesn’t have for the share buyback could be returned with dividends…).  The current P/E ratio is quite a hefty 18.4, and based on analyst predictions, the forward P/E of 16.8 doesn’t earmark this share as a bargain either.  Having said that, this is clearly a successful company in an enviable market position, so I intend to keep hold of the shares.

On 7th February, Compass released a statement covering the first quarter of the year.  Overall things have progressed well and organic revenue growth was 6%.  However, conditions in the three regions remained similar to that expressed above.  Revenues were good in North America, strong in emerging economies but week in Europe and Japan.  However, the measures that have been put in place to reduce costs are apparently going well.  A few more acquisitions have taken place – all in the Americas and all seem to be quite sensible.  Overall, fairly good – no surprises in this statement and the shares for me are still a hold.

On 26th March, Compass released a statement covering the first two quarters of the year.  It seems things are much the same and trading remains strong in North America, with revenues up 8.5% on a comparable working day basis.  In Europe, things continued to deteriorate and revenues on the same basis are expected to be 2.5% down, although the cost cutting exercise should mitigate this effect somewhat.  Emerging markets continues to perform well, with the oil and gas industry in Australia singles out as being particularly good.  Revenue growth is expected to be over 10% in the first half with a similar profit margin.

About £80M has been spent on further acquisitions, with acquisitions in Colombia, US and Canada.  The share buy-back program continues to progress.  Overall, this is a good update.  Revenues in North America and emerging markets are progressing very well, and it is quite exciting to see some up and coming economies becoming more important for Compass.  The European results continue to drag but the cost cutting methods seem to be bearing fruit.  Still a strong hold for me.

Braemar Shipping Blog – Interim 2013

BraemarlogoWEB


Braemar have released their interim results for the year ending 2013.  As normal I will start with the income statement.

braemarincome


Revenue has increased substantially on the same period of last year.  Shipbroking revenue is quite flat, while logistics revenue fell by £800K.  Technical revenue is increasing steadily, and has been a growth focus for Braemar as late as they try to diversify away from shipbroking, up by £3.6M.  The big increase, however, is from the environmental segment, up a massive £14.8M to £17.1M as the group ramp up the recovery related to the MSC Rena.  Cost of sales are also up, but overall gross profit is up £6.5M.  We can also see operating costs up, and the lack of income related to the acquisition which means that operating profit is only £145K up, at just over £5M.

After a bit of finance income is counteracted by an increase in tax the profit for the period was broadly similar to the first half of 2012, up £100K to £3.7M.  Unfavourable foreign exchange rates mean that the actual income received was £765K less at £3.3M.

braemarassets


Looking at the assets initially, we can see these are almost uniformly down on the position at the end of the year.  Ignoring the restricted cash, which has a liability against it, the rest of the assets are down slightly.  The tax asset is probably the biggest faller, down half a million to just over £1M.  Total tangible assets are down by £900K to £74.1M.

Liabilities are also lower, with trade and payables down nearly £3M to £34M.  This means that net tangible assets increased by £600K to £34.4M.

braemarcash


Overall, cash from operations from the first half of the year was £5.8M.  This compares to an outflow of £6.8M for the same period of last year.  This positive swing is due to better control over payables.  After tax and interest was paid, the group still had an inflow of £4.3M.  There does not seem to be much in the way of capital expenditure here and there was a small amount of cash paid for acquisitions which means that before dividends, there was an inflow of £3.9M.  Most of this was then paid out to shareholders to leave a cash flow of £229K.  Unfortunately due to the unfavourable swing in exchange rates, the cash position was very slightly worse than the same period of 2012, however, the position was much better than last year.

Most of the profit is still from shipbroking, but the Environmental sector achieved the second highest contribution, receiving more than twice that of the Logistics business, which is a little concerning given the volatile nature of environmental revenues.  Technical profits were only £1.2M, which was lower than the same period of last year.  Actually, all sectors had lower profits than the first half of 2011 apart from the Environmental segment.

In the half year the group purchased Orca Shipping for £820K.  It came with £509K of cash so in total £311K was spent on this acquisition, £79K of which was deferred.   I am not sure what Orca do exactly but it seems to have come fairly cheap and contributed £49K to the profits during the period.

The shipping industry in general has continued to struggle as most sectors still suffer from a surplus of tonnage and a weaker rate of growth in the Far East, which is the main driver for global shipping and fleet growth continued to outstrip supply.  However, the rate of scrapping has quickened so the excess tonnage continues to work its way through the system (also good because Braemar are involved in the scrapping business too).

During the half year, the CEO left the company and was replaced by the CFO, James Kidwell and a new CFO was recruited, Martin Beer.  I hope this won’t cause too much instability as I felt the outgoing head did a good job.  Time will tell, I guess.

Going forward, the work on the MSC Rena should continue to the end of the year, but after this a substantial contributor to the profitability of the group will be lost.  The other divisions are expected to continue as they are for the rest of the year.

In bulk shipping, fleet growth was 9% in 2012 as newbuild deliveries outstripped demolition, however scrapping rates have increased in recent months.  Demand for bulk cargoes such as coal and grain continues to increase but the slow down in China has led to a reduction in iron ore demand.  Having said that, performance of the group in this market has been good.

Transaction volumes for single tanker voyages have increased but the time charter business remains slow with owners reluctant to commit in the present climate but the levels of enquiries are beginning to increase.  The growth in deep sea tanker fleets was 3.5% and the trade in crude oil continued to increase, driven by demand in the East and new refineries are being built in this region to accommodate this demand.  The demand for crude in the US is falling, however, as greater fuel efficiency and lower demand takes effect.  The specialised tanker team has performed consistently with a good level of contract business for European clients.  The LNG tanker market is expanding.

The container market remains challenging due to the lack of consumer demand but the group are anticipating a cyclic recovery.  Vessel values remained low and second the second hand market was slow.  There is more of an opportunity in the demolition market, however, as the surplus tonnage and a reasonably strong steel price keep things ticking over.  The offshore vessel market is strong, and there have been good revenues from this sector, particularly in the Far East and East Africa.

The technical division has grown revenues and the Offshore, Engineering and Surveying businesses were all busy in the Far East.  The group are also involved in some long term offshore energy projects in the Asia Pacific region, providing warranty surveys and engineering consulting, and have opened an office in Thailand to capitalise on this as the group expect this to be a growth prospect. The salvage business performed within expectations  and the adjusting business showed a steady performance with work in the tar sands region in Canada and offshore business in South America.  Braemar Engineering is working on several LNG construction projects but offshore engineering work in the Gulf of Mexico has been more limited than expected.

Within the logistics sector, the UK and Singapore ship agency business performed well and has recently won some important new contracts, including managing the European hub for an oil company.  The logistics performance was lower than last year due to the lack of one-off project forwarding business and the Olympics did not provide the boost for the cruise business that was expected.

As previously mentioned, the Environment arm that is working on the MSC Rena has been a major contributor in this half of the year.  The sector does have some ongoing contracts and consultancy in this area but as the recovery of the Rena is winding down, income will be far lower next year.

So, for the half of the year revenues are up substantially but this has been driven by the one-off work on the MSC Rena.  Other divisions were more steady but revenues were down in Logistics, which did not benefit from the one-off projects they had last year.  Profit is fairly level at £3.7M, which is a bit of a worry given that a fair amount of that was contributed by the Environment sector.  Cash flow was fairly decent, pretty much neutral once the dividend was paid out.  There is now a new CEO in charge so it will be interesting to see how the group performs under him.  The dividend is a whopping 7% and the group has not performed badly this half of the year, plus there is no debt here at all.  However, I have concerns over where the revenues are going to come from once the work on the Rena has been completed.  Overall I continue to hold.

On 16th January 2013, Braemar released an interim management statement.  It was mentioned that Shipbroking was facing challenging conditions with excess capacity affecting rates and that an increasing proportion of business is on the spot market.  The technical services segment performed as expected, as did the Logistics division as the hub agency contract mentioned in the last update started.  However, revenues from the Environmental division was less than expected as the involvement in the MSC Rena project reduced quicker than expected.

Although, there is not much here that wasn’t known already, the fact they mention their two most profitable sectors are finding things tough is a real worry and I expect profit to be down for the full year.  I still hold, however for the moment.

Laura Ashley Blog – Interim 2013

laura-ashley-logo


Laura Ashley have released their half year results for 2013.  As usual I will start with the income statement.

laurashleyprofit


Income is up across all sectors, with e-commerce and non-retail doing particularly well.  Geographically, revenues were up across all territories with the UK and non-Europe doing the best.  Cost of sales were up slightly less to give a £1M increase in gross profit.  There was not much change in Operating costs so operating profits for the half year were £1.2M higher at £8M.  Tax increased slightly to leave the profit for the period £900K up at £6.2M.

laurashashleyassets


Since the end of last year, both assets and liabilities are down.  The main assets to fall are inventories and cash, which was down £7.2M to £27.8M, which is a bit of a shame.  The main change in liabilities was the decrease in Trade and Payables, down £7.5M to £70.1M so I guess we can see where that cash went.  Overall this means that net tangible assets barely changed – down just £100K to £60.3M which is pretty good given the lack of debt.

On to the cash flow:

laurashleyprofit


Although the group achieved £10.4M from profit, as we have already seen, £7.5M was spent on paying off some of those payables.  This means the cash from operations was £3.6M.  After Capital expenditure (less than last year) and tax (more than last year) was paid, there was a completely neutral cash flow.  £7.3M was then paid out in dividends so the cash outflow for the half year was £7.2M.  The cash flow of Laura Ashley has been a little disappointing of late.  The situation seems to reverse somewhat in the second half of the year but even so, despite the substantial cash pile, this is not a sustainable situation.

Although by far the largest amount of revenue is obtained from the stores, non-retail now accounts for the biggest share of the profit – this includes the franchising and licencing sectors.  The stores and the e-commerce accounted for the next highest share as margins fell in the retail side due to a high amount of discounting in the sales, and no profit has yet been made by the hotel.

During the year, UK store numbers stayed the same as the group concentrate on expanding sales from existing stores.  E-commerce and mail order now account for nearly 18% of UK sales as rising e-commerce sales more than make up for lower mail order sales.  During the first half of the year, an app was introduced to help the e-commerce side and a click and collect service will be introduced in the second half.

Within the UK sales, the sales of furniture decreased by 1.1%. This was rather disappointing but it did apparently outperform the market and achieved good online growth.  Fashion sales were also down (1.2%) but again this outperformed the market and did well in knitwear, dresses and blouses.  Sales of decorating products did much better, up 4.7% due to the fact that the group can respond quickly to differing trends due to the items being manufactures in the UK.  Sales of home accessories did best of all, up 9% and showed significant growth in bed linen, lighting and gifts.

The refurbishment of the hotel the group purchased last year has commenced and it is due to be launched in the second half of the year – it will be interesting to see what the group intends to do with it.  Franchising operations are increasing (as already mentioned non-retail accounted for the highest amount of profit during the first half of the year).  Nearly 20 new franchised stores were opened, including two in Russia and some in Japan, Taiwan and Australia.  The franchising operations make up the bulk of the non-retail revenue.

So what have we got here?  Well revenues are certainly up across the board but the big growth areas are e-commerce and the overseas franchise operations and the increase in UK sales could be down to heavy promoting which seems to have hit margins slightly.  Profit for the half year is up nearly £1M.  The cash situation continues to be come cause for concern as £7.2M was lost in the half year.  To some extent this is a cyclical trend but I am not sure the second half of the year will counteract it enough.  Going forward, the group may concentrate on the franchising.  There is no debt, which is clearly good and the dividend payout has been held and is still 7.4% which is a remarkable return in this market.

Overall, the cash flow is a bit of a concern but there is no debt and a stonking 7.4% dividend so I may try and buy some more.

On 14th December, Laura Ashley released a management statement.  Total sales up to that point had increased 4.2% on the same period of last year.  Within that, E-commerce continued to grow and was up over 22%, boosted by the new mobile site and increased overseas deliveries.  The gross margin is likely to be lower than last year due to heavier discounting to maintain increased sales and the store portfolio has increased by 2.  All in all, not a huge amount given away and this does not change my stance on the company.


Photo-Me International Blog – Interim 2013

footer_photo-me_logo

Photo-Me have now released their half year results for 2013, I will start with the income statement.

photomeinterimincome


We can see that again, revenues have fallen.  The operations revenue is down £3.7M to £94.2M, and the sales & servicing revenue has fallen even more drastically – down £4.6M to £13.2M.  The cost of sales have fallen a similar amount, however, and this coupled with a lower depreciation bill ensured the gross profit was £2M higher.  Admin expenses are also lower than last year so the operating profit is actually nearly £3M up, at £20M.  The tax charge is slightly higher, as would be expected given the higher profit, which all means that the profit for the year was nearly £2.5M up at £14.3M.   Unfavourable exchange rates pegged this back slightly, however, to leave the total income £1M up, at £13.8M.  This is quite a respectable performance in my view.

Next, the statement of financial position.

photointerimassets


Overall we see that total assets are up by £9.5M to £169M.  Pleasingly this rise is down to an increase in cash – up a whole £16.1M in just half a year!  Most other assets are down on the end position of last year, with inventories being hit the hardest, down by £4.5M to £12.5M.  The only other significant movement seems to be in intangible assets.

Total liabilities increased by £4.4M to £67.2M.  This was due to a nearly £3M increase in the current tax liability (as the group makes more of a profit) and a £5.5M increase in payables which suggests the group may be ramping up trade somewhat (I am not sure exactly what payable have increased so this is a guess).   Otherwise we see the group continuing to pay back debt, and there is now less than £3M in bank loan liabilities on the books.

All the above means that net tangible assets are up a respectable £6.3M in half a year to £84.2M.

Moving on to the cash flow:

photointerimcash


The bottom line here is the £16.5M cash flow for the half year, that is £15.4M more than last year and really an incredibly good performance.  Cash generated from operations was £5.5M up, boosted by tying up less money in inventories and good control over payables (we have already seen payable liabilities are up).   The group spent slightly more on capital expenditure than in the first six months of last year but benefited from the sale of a property, which netted £3.2M in cash.  The property that was sold was the former home of the KIS division, which moved out of its premises in France as part of the restructuring of the division.  The other main difference from last year is the fact that as the debt winds down, the group needs to pay less back and that is evident here as only £2M was spent on repaying bank loans (compared to £8M).  Dividend payouts increased by just under £1M but still the group is able to achieve a very good cash inflow.  No wonder the board are considering giving more back to shareholders and now there is a cash pile of over £70M which could hint at quite a substantial payout.

Photobooths make up the bulk of the profit for the Operations division and is a significant cash generator.  The group is undergoing an expansion in Germany and is involved in a rollout of a newer design of Photobooths which are showing a 50% increase in turnover.  The group are also targeting new markets for the Photobooths and has launched its first machine in Malaysia.  They are also testing the market in Thailand and Ukraine and examining an entry into Turkey and Poland.

The big news in this update, however, is the announcement that the group is looking into stand-alone heavy duty laundry units after an extensive trial in France and Belgium showed that the units stood up durability wise and took enough money to make them viable.  Utilising the same sites as the Photobooth units, there will be an aggressive rollout in France and Belgium, initially, before looking at other European markets.  The average EBITDA of the units is apparently over 50% of turnover (but the exact figure is not stated) and costs should be reduced when the manufacture of the units moves from France to the Far East.  The fact that the machines use the same current sites that the group has for the Photobooths and also uses the same service engineering network ensures that they can be offered at a competitive rate.  The board predict that these machines should be a significant contributor to profits within three years.

Digital printing kiosks are focussed on France and Switzerland and they now include more value added items such as calendars, greeting cards and postcards, together with a scanner for photo replication.  Trading for the printing kiosks was on a par with last year.  The amusement and business service equipment struggled again, with small reductions in revenues recorded.  It is planned that a single logistics and distribution platform for European operations will bring further cost savings.

The Sales and Servicing division has undergone substantial restructuring over the past couple of years and is now much smaller than it was.  Over the past half year, revenues have reduced but profits are actually up when compared to the same period of last year.  The market has remained difficult but the group has managed to deliver some Pocket book makers to Mitsubishi and Fuji.  Sales of the new mini lab have been subdued by the ongoing weakness in the photographic printing marketplace.

The same risks remain from the full year report and the collapse of Jessops may have a detrimental effect on group revenues.  The first half of the year is traditionally much stronger for profits so gives an indication as to the fortunes for the full year.  This year, revenues have fallen but profits have increased.  It does seem as though Photo-Me is now a much leaner, more profitable organisation than it was a few years ago.  Debt has been pegged back substantially in the last two years and now that it is almost paid back, there is less need to spend cash on the repayments and this is the main driving factor for the hugely impressive cash inflow in the last six months.  There was a one-off £3.2M cash gain from the sale of the old KIS building but even without this, the group would have made £13.3M in cash during the 6 months.

Looking forward, the move into laundry machines is an interesting one.  Initially it doesn’t seem to entirely fit with the other offerings but there are overlaps and it is something that I will be watching closely in the near future.  As long as the Photobooths continue to generate cash, it is an experiment that the group can afford to conduct without the need to take on new debt.  Speaking of the Photobooths, the move into new markets is a good development and it is especially good to see the move into emerging markets such as Malaysia.  There was absolutely no mention of any progress in China, however, which was a little disappointing.

On the current share price, the increase in dividend means that it is trading on a yield of 4.1%, which is actually pretty good, especially with the promise of further shareholder returns.  Overall then, this has been a very positive update and if I didn’t already have quite a number of these shares I would look to buy more.  In fact, I may do so anyway on any dips.

On 4th February, the group announced plans for the special dividend.  A total of £11M will be distributed to shareholders, which works out at 3p per share.  On today’s share price, that is a return of 4.5% so a very decent incentive in my view.  The ex dividend date is 13th Feb.

On 8th March 2013, Photo Me released a statement covering the first three quarters of the year.  In Q3, profitability was substantially better than in the same period of last year.  In the first nine months of the year, revenues in the Operations division was very similar to that of last year but due to cost savings from lower manufacturing costs, profits are up on last year.  Performance in Japan and Germany was particularly good.  Going forward, further cost savings due to the central logistics platform in Europe should show benefits next year and onwards.  The new Starck photobooths are delivering improved returns and the new laundry machines have started to be delivered.

Sales and Servicing suffered reduced revenues in the period but due to the restructuring, it is no longer loss making.  Cash generation of the group is still good and shareholders have now benefited from the special dividend announced in the last update.  So far, this is a very good update but the only cloud attached to this large silver lining is the adverse affect of currency movements.  This will apparently have the effect of reducing pre-tax profits by 8% so it is testament to the good progress being made that management still expect to hit market expectations for the year. Overall, this is still a very good stock to own and the share price has come on very well since the last update and now looks about right to me – a strong hold.