Air Partner Share Blog – Full year 2012

Air Partner provides different types of aircraft for charter and related aviation services.  Private jets involve the charter of smaller aircraft (under 20 seats) for groups, individuals, air ambulance service and road shows; commercial jets involve the charter of larger aircraft for governments, industrial clients, commercial clients and tour operators; freight involves the charter of cargo transport including emergency aid drops and a time critical door to door delivery service; and support services encompass fuel, emergency planning, and an in-house travel agency.

Air Partner has now released their full year results for the year ending 2012.

airpartnerincome


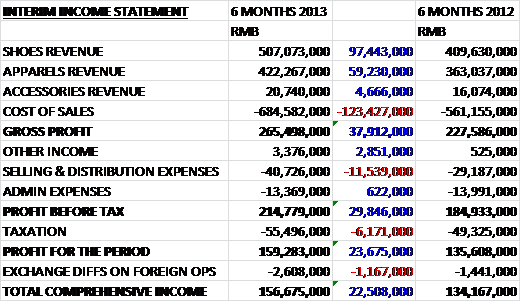
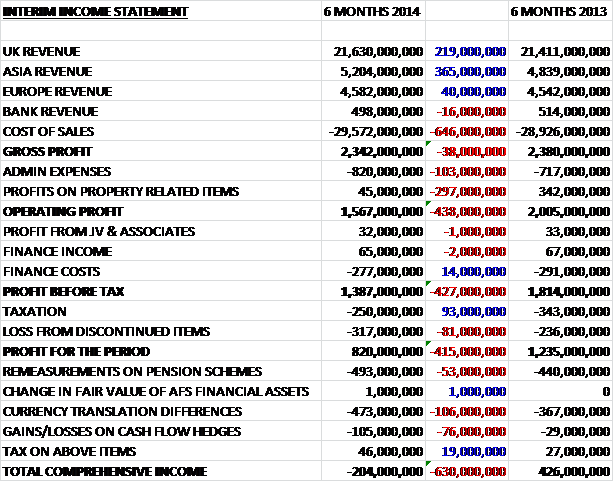
Total revenues at £227.6M were down a substantial £54.4M on last year. Commercial jet brokerage fell by £31.1M but remained the largest business segment; freight brokering fell by £15.9M, other services were down by £10.7M but private jet brokering bucked the trend with a £3.3M increase in revenue.  Thankfully, cost of sales also fell considerably, which, along with a favourable £1.2M foreign exchange gain meant that gross profit was down by just £4.1M.  Admin expenses fell by £1.5M and the group also benefited from a few one-off gains – there was a £1M accrual write-back, which were estimates of invoices and credit notes for revenues, and costs relating to air charter contracts that it was decided were no longer needed; and a £443K release of US excise provision, due to a lower tax bill than was provided for, somewhat mitigated by a £319K restructuring cost.  This meant that tax from continuing operations before tax was down by £1.1M and a much better tax bill was counteracted by the lack of discontinued profits from last year so the annual profit for the group was £1.1M down at £3M.

airpartnerassets


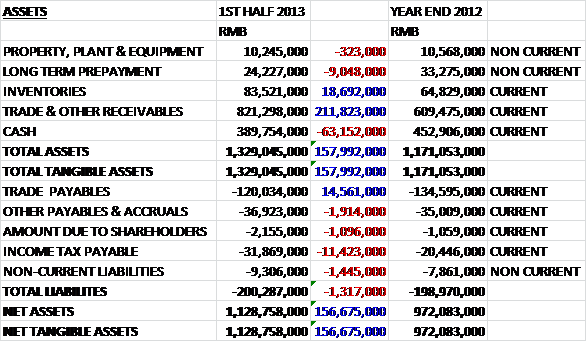
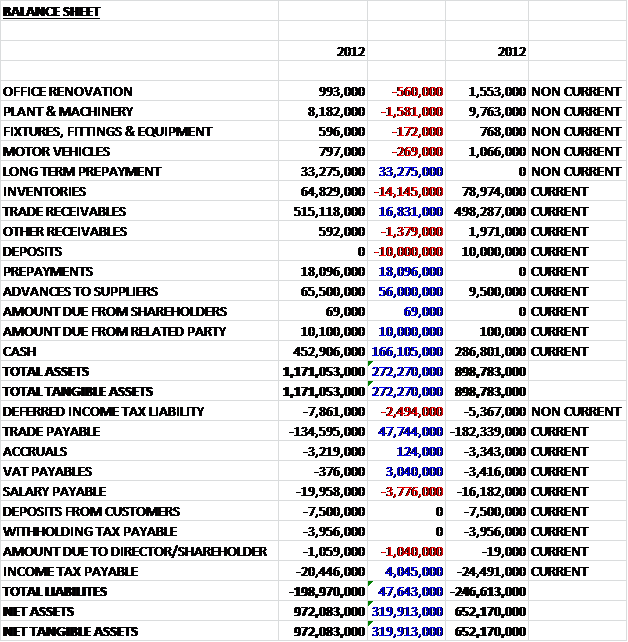
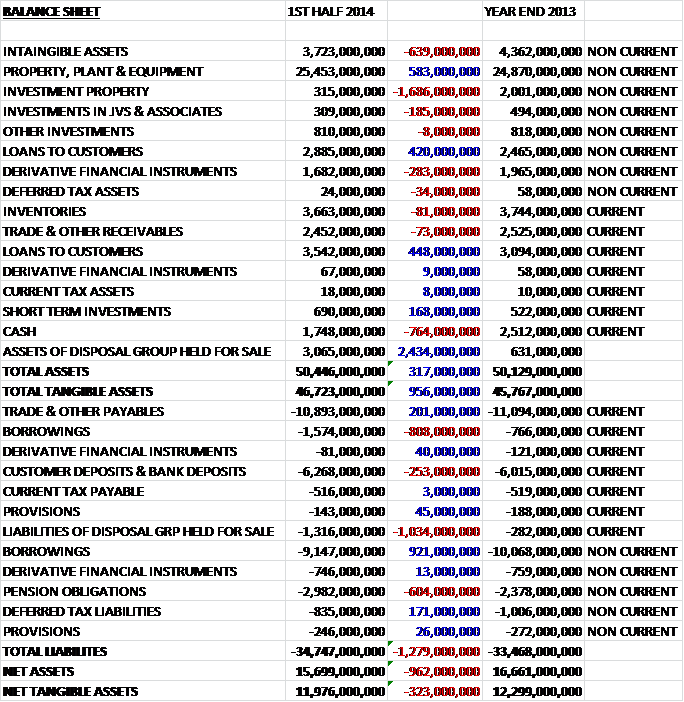
Overall assets were down by the tune of £5.7M at just under £50M.  The main falls were recorded in trade receivables, down by £9M; prepayments & accrued income, falling by £4.4M and the loss of ain aircraft worth £980K, which looks as though it has been impaired somewhat and placed in assets held for sale.  These falls were counteracted by an £8.6M increase in the cash levels.  Thankfully, liabilities also fell.  The largest improvements were in trade payables, down £6.1M; “other” liabilities, down £1.1M; the loss of the US federal excise tax provision (£1M) and the £812K reduction in accruals.  These were somewhat mitigated by a £2.2M increase in deferred income which means the net tangible assets increased by £893K overall and now stand at just under £13M.  The admin claims provision is held in relation to potential settlement claims following the closure of Air Partner Private Jets and the group expects all of these to be settled by the end of July 2014.  The restructuring provision relates to redundancy costs due to the structural review that took place this year and the dilapidation provision was paid in full.

airpartnercash


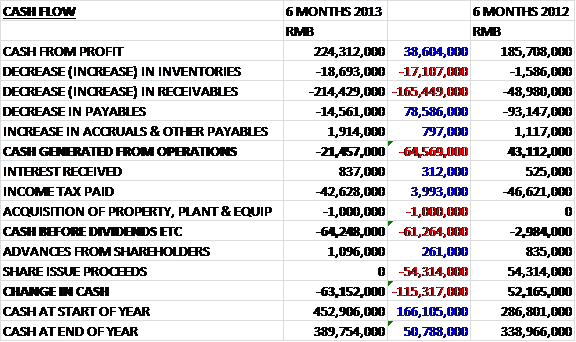
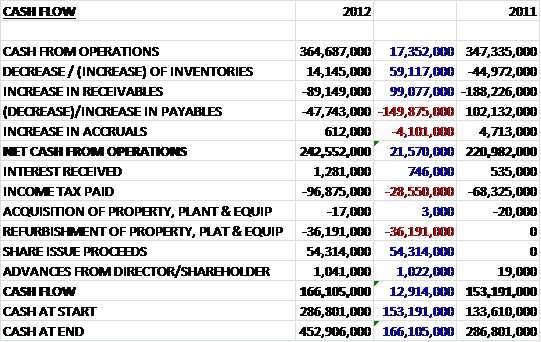
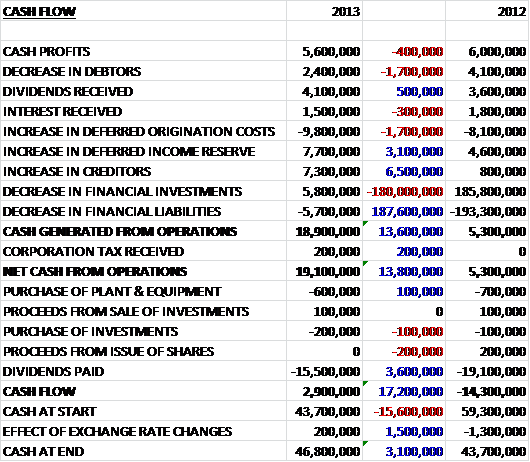
Operating cash of £4.2M was some £2.1M below than of last year but a huge decrease in trade receivables meant that the cash actually generated from receivables was £12.2M.  After tax was paid and the contribution from discontinued operations was taken into account, which related to the cash received from the administrators after the closure of Air Partner Private Jets, the net cash from operations was £11.6M, £13.6M higher than last year.  The group then spent a small amount of money on tangible assets and computer software to give a cash flow before finance of £11.1M.  There was then £1.7M spent on dividends which left the change in cash during the year of £9.4M (£14.1M up on 2011).  This does look rather good, although the positive result is almost entirely due to the payment of a large chunk of receivables.

The group seems fairly reliant on one large client which accounted for 17% of revenues during 2012.  This was an improvement on the previous year, however, when that client accounted for more than a quarter of all revenues.  There does seem to be some very late trade receivables and worryingly, £349K of them were overdue by more than a year.  The chairman, Aubrey Adams resigned after being appointed at RBS and Richard Everitt was appointed in his place.

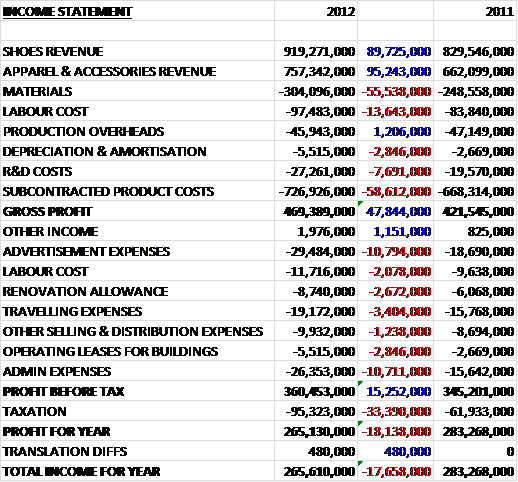
Private jets were the only sector to increase revenues year on year (up 8%), driven by a 67% increase in USA sales (now at £9.2M), although ad-hoc UK sales also increased and non-government contracts made up a greater proportion of the work than previously due in part to continued austerity measures put in place and an increase in jet card members.   There was a slight reduction to the underlying profit for the group due to increased overhead allocation now that the division makes up a greater percentage of total revenues.

Commercial jet revenues fell by 18% on last year and suffered a 51% decrease in profits to leave underlying profits at £1.6M, due to increased competition and the oversupply of aircraft but the group did find new revenue streams in the oil and gas industry and there was growth in the niche tour operator and conference sector.   Sales to tour operators in Austria, France, Italy and Germany continued to grow too.  The division has now re-organised and they are now focusing sales efforts around specific industry segments where there is more potential for growth, such as in oil and gas.  Some of the requests that the division dealt with included repatriating stranded cruise passengers from South East Asia; providing tour transport to music stars; supporting major sporting events; and supporting product launches.  They also co-ordinated over 100 flights for a car manufacturer to launch their new model in Ibiza and Alicante, and 30 flights for the Euro football championship in Poland and Ukraine.

Freight revenues fell 38% year on year and underlying profit fell by 41% to just £300K due to the decline in global freight market, although the time critical product gained momentum.  Overall, though, management don’t see a short term pick-up in this division so have lowered the cost base to reflect this.  Two examples of work over the past twelve months include the urgent transport of critical components for a formula one team just before a grand prix and the transport of emergency relief aid to Turkey following a major earthquake.

Support services also saw revenues fall, this time by 36% and underlying profits were down by 54% to just £300K, again due to the market over supply of aircraft and the very competitive market within aircraft sub-leasing and fuel.  The fuel contract with British Airways was renewed, however, and costs were reduced in some parts of the segment but overall management as re-aligned this part of the business to be more of a support to the rest of the group rather than a stand-alone segment in its own right.

Overall, market conditions were tough this year, with the added issue of a lack of exceptional world events such as the Arab Spring and the Japanese Tsunami which boosted revenues previously.  As such, the board is cautious about the outlook next year.  The strategy will be to aggressively target the US market, growing private broking in Europe (where their current market penetration is only 2%), proactively market within the oil & gas sector and to target the tour operator sector.  In addition, where margins are attractive, the group will be looking to emerging markets.  As part of this desire, they launched a strategic partnership with InterGlobe in New Delhi, providing a range of private aviation products in India based on a low-cost model.  The group is involved in a business that by definition has a very low visibility but is also allied to the general economic outlook.

At the time of writing, the decrease in the final dividend meant that the current yield is 3.3%, which is not too bad but the current P/E is 17.3 which seems a bit lofty for a company which seems to be stuttering on growth.  There were no broker forecasts to try and ascertain a forward looking P/E.  Profits were down across nearly all sectors due to increased competition and a decline in the global freight market.  Net assets actually improved, but would not have done were it not for the release of the provision held for the US government taxes.  Cash flow was the one shining light, achieved by keeping a tight reign on receivables.  There is also no debt here which is always nice to see.  I do think there is a decent case for investment here but the outlook seems a little too pessimistic for the share valuation in my view.  I will keep abreast of new but not yet invest.

BP Finance Blog – Q3 2013

BP has now released an update covering the first nine months of the year.

bpincomeq3


Revenues for the first nine months of the year were up compared to the same period of last year driven by a $5.753B increase in downstream revenues.  By contrast upstream revenue decreased by $2.067B and earnings from associates fell by $1.611B.  Other business revenues also fell slightly. The total revenues, however, were flattered by a $13.072B gain from the sale of businesses and assets.  The main increase in costs was a $4.678B hike in purchases which was counteracted by a $3.96B fall in impairment losses on business sales due to the lack of sales of quite so many refineries,  a $1.416 reduction in production and manufacturing expenses and a $529M slide in production taxes to give a profit before tax some $14.191B higher.  A $1.232B increase in income tax, however, gave a profit for the nine months $12.959B up at $22.66B.

bpbalanceq3


Overall total assets at the end of the third quarter were up by a substantial $10.923B.  We can see the effect of the TNK sale as $19.315B of assets held for sale were converted into $12.213B of investments in associates and $9.864B extra cash (clearly there was another gain involved there too).  Otherwise we also see Property, Plant and Equipment up by$4.822B; Trade and receivables up by$3.242B, inventories up by $1.186B and other intangible assets increase by $1.190B. Not all assets were up, however, as the value of derivative financial instruments fell by $2.341B and other investments were $1.034B lower.

Liabilities were fairly flat but did fall by $576M.  The large increases were seen in deferred tax liabilities, up by $2.164B; trade payables, up by $1.636B; other payables, up by $2.512B and loans, which were $1.484B higher.  By far the largest fall seen in liabilities was in provisions, which was down by $4.564B in the first nine months of the year due to $3.933B relating to the Gulf Region Health Outreach Programme being re-classified in other payables, $2.562B being paid by the trust fund, $390M being paid by BP, and $379M derecognised from provisions as they could no longer be accurately predicted.  These movements were somewhat mitigated by a $1.888B increase in business economic loss provisions and higher claims administration costs, and a $407M increase in relation to the write-down of the value of inventories with the other major fall a pleasing $2.581B improvement in pension obligations.  This all meant that net tangible assets were up by a very impressive $10.424 to $93.354.

bpcashq3


Cash profits for the first nine months of the year were $1.111B higher than in the same period of last year at $28.526.  This cash income was eroded by nearly $8B of adverse movements in working capital and $4.887B in income tax payments.  This left the net cash from operations of $15.686B, which was $1.586B up from last year.  Once again, however, capital expenditure was higher than net cash from operations at $17.722B ($1.559B more).   After operations the big cash generators were the $17.743B of proceeds from the disposal of assets and the $3.879B in proceeds from the disposal of businesses minus the close to $5B that was invested into associates.  Other areas where the group spent the proceeds were the purchase of their own shares, which cost $3.093 and the payment of dividends which came to $4.523B.  On top of this the group for some reason decided that they needed to increase net borrowings by $2.849B which drove the cash income to heights of $9.864B which was $7.867B higher than last time.  This cash flow is impressive on first sight but perhaps not so much when the huge proceeds from the sales of assets and businesses are taken into account, as the net operating income does not cover capital expenditure.

The issues relating to the Gulf of Mexico spill are still having an effect on the group and the third quarter gave a charge of $39M which put the total for the year to date at $280M and a total charge since the start of the disaster of $42.487B.  The trust fund that was set up to pay for the spill is starting to dwindle and there is now only $695M left unaccounted for, after which BP will have to start paying for the claims from the income statement.

The legal claims and appeals are still ongoing but the court recently upheld an appeal from BP relating to the administrator’s interpretation of proper claims, the immediate upshot of this is that the court has ordered the administrator to temporarily suspend any payouts for claims that are not sufficiently supported.  This has also had the consequence of BP de-recognising provisions for any claims that were agreed but not yet paid as they could not reliably estimate the cost to the group.  At the end of this period, BP’s estimate for the cost of the PSC settlement for individual and business claims was $9.2B, which is $400M less than at the end of last quarter but $1.4B more than at the end of last year.  The final cost is likely to me much higher due to the fact that not all claims have yet been received and even in the last quarter, eligibility notices have been issued for claims totalling $650M.

The trial to ascertain whether BP’s actions consist of Gross Negligence is still ongoing, along with the court case to determine the volume of oil that spilled into the Gulf.  This is a very important case as if BP is considered to be grossly negligent then they could be facing huge charges.  Another ongoing case involves the efforts of BP to overturn Texas’ decision to suspend and debar BP from any future government contracts, of which there was no news.  As reported previously at the end of last year the court gave a final judgement on class action settlement relating to the PSC settlements.  Of the seven groups affected, five have appealed the decision with the appeals being heard in November.  In addition, one group filed an appeal with regards to the Medical Benefits Class Action.

After an investigation it was found that the conduct of two attourneys involved with the DHCSSP claims may have violated federal criminal status regarding fraud, money laundering, conspiracy or perjury.  A motion by BP to suspend all payments from the DHCSSP until such a time that improved anti-fraud controls are implemented is under consideration.  As well as the claims from people directly affected by the disaster, BP is also fighting claims from Pension funds and shareholders with regards to the loss of value in their investments in the group.  It has been decided that jurisdiction for most of these claims (with the exception of federal law claims based on the purchase of ASDs and a potential claim under Ohio law by certain Ohio funds) lies in UK courts.  There is also another claim originating from Canada on behalf of a group of Canadian residents that has not been transferred to a UK court.

Some other ongoing legal claims include one by BP, who are trying to state that they may be partially covered by insurance policies issued to Transocean.  A date and time for this hearing has not yet been determined.  Four Mexican States filed a claim in a Texan court which was dismissed.  The states involved have appealed the decision.  Not all legal claims are based on the Gulf of Mexico spill, BP are also being investigated regarding the manipulation of the next day fixed price gas market at the Houston ship canal.  The maximum penalty seems quite modest at just $28.8M, however.  The penalty in regards to the historic issues at the Toledo refinery currently stands at just $80K, a review of the judge’s decision is underway.  The court has dismissed most claims for damages relating to flaring at the Texas City refinery.  The only remaining action there involves the federal government enforcement action.  A settlement regarding the violation of the clean air act at the same refinery resulted in a charge of $950K pending court approval.

Underlying Upstream RC was $14.413B for the first nine months of the year compared to $15.061B for the same period of last year.  For the third quarter, the result reflects lower sales due to divestments and higher exploration write-offs, somewhat offset by an increase in underlying volumes and a one off gain due to the US Federal Energy Commission approval of cost pooling settlement agreements between the owners of the Trans Alaska Pipeline (TAPS).  Although production for the third quarter was actually 2.3% down in Q3 2012, discounting the effects of divestments and entitlement impacts in the production sharing agreements, underlying production actually increased by 3.4% due primarily to major new project volumes in the North Sea and Angola and the absence of weather related downtime in the Gulf of Mexico.  Underlying production in the first nine months was up by 3.1%, although down by 3% including one-off items. In Q4, volumes are expected to be broadly flat with increased costs due to the absence of the one-off TAPS pooling benefit.

In the quarter a number of milestones were reached including the installation of Clair Ridge platform jackets in the North Sea; the announcement of a new gas condensate discovery off the East coast of India; a significant gas discovery in Salamat in the East Nile Delta; gas production was started at the Woodside operated North Rankin 2 project in Australia, in which BP has a 17% stake; and the start of three farm-out agreements with Kosmos energy covering three blocks in the Agadir  basin offshore Morocco.  Under the terms of this agreement, BP will acquire a non-operating interest in the blocks.

Downstream RC had a similar decline than in upstream, down from $5.069B to $3.562B due to much lower Q3 production.  The results in Q3 include $157M of charges due to the reassessment of environmental provisions.  The RC for the fuels business was $2.434B compared to $3.993B in the same period of last year as third quarter results were impacted by weaker refining margins along with the absence of earnings from the divested Texas City and Carson refineries.  Another factor impacting the nine month result was the planned outage at the Whiting refinery as part of the modernisation project which should be up and running by Q1 2014.  Next quarter, the group expect refining margins to remain under pressure due to very high gasoline stocks and increased competitor capacity.  RC at the lubricant business for the first nine months of the year was $1.042, actually up from last year’s figure of $956M as targeted marketing programs contributed from the strong performance of the premium Castrol brand.  It was notable that during the period about 50% of sales came from emerging markets.  The Petrochemical RC was a mere $86M compared to $120M in the first nine months of last year  as both margins and volumes remained under pressure.  The situation did improve in Q3 compared to Q2, however, which might bode well for the end of the year.

The Rosneft RC this year was $1.111B whereas last year TNK-BP had an RC of $2.903B.  Overall underlying RC for the year was $10.619B, down from $13.219B and included positive impacts from foreign currency exchange, a favourable duty lag effect and higher oil prices.  This also included a £456M dividend payment which is not expected to be repeated before the end of the year.  The underlying RC lost for other business segments was $1.284B, an improvement from the $1.548B loss in the same period of last year and this result included a non-operating charge of $430M due to changes in environmental provisions.  There was an increase in the amount of power generated from the wind farms and also an increase in production from the three biofuel mills in Brazil.

Net debt at the end of the period stood at $20.051B, down $7.414B from the end of last year when it stood at $31.325B due to the sale of assets and businesses, and the subsequent increase in cash balances but up from the end of the last quarter when it was $18.217.  Profits before tax were up by $14.191B but it must be remembered that $10.787B came from business sales and there was $3.96B less impairments on those business sales.  Net tangible assets improved by £10.424B which seems to be mainly because $19.315B of assets held for sale was turned into $12.213B investment in Rosneft and $9.846B in cash so it seems that BP did get a decent amount for the BP-TNK sale compared to the book value.  As far as cash was concerned, the capital expenditure was higher than the net cash from operations which was a worry but it was of little importance this year due to the huge $17.743B cash injection from business sales.  RC profit was down across all business sectors except lubricants with the Fuels business doing particularly badly due to divestments and poor refining margins which do not look like improving any time soon.  The Gulf of Mexico disaster did seem quite during the period and a decision actually seemed to go BP’s way for once!  A dividend of 9.5c was announced for Q4 which was an increase of 0.5c on the last quarter, which relates to an annual yield of 4.9% which is just about worth holding onto in my opinion.

On 16th December BP announced that they had signed a gas sales agreement with the government of Oman for the development of the Khazzan field with BP as operator.  The development will involve a drilling programme of around 300 wells over a 15 year period with ultimate volume of one billion cubic feet of gas per day along with 25,000 barrels a day of gas concentrate.  The total investment in the project is likely to be around $16B, including the appraisal expenses to date so it is a major project involving an unconventional gas source that requires significant expertise to access.   The first gas will not be produced until 2017 and plateau in 2018.  The agreement also included a joint venture to develop a one million tonne a year Acetic Acid plant that may be ready by 2019.

On the 18th December the group announced that the new coker was commissioned at the Whiting refinery which was the last new major unit to come be updated.  The reconfigured refinery can now greatly increase its heavy sour crude processing and is expected to deliver an incremental £1B of operating cash flow per year dependent on market conditions once it is properly up and running by the end of Q1 2014.  This seems to have been delivered on time and as expected and I must say the projected cash flow from this refinery is rather impressive.

Also on the 18th December it was announced that the group made a significant oil discovery at the Gila prospect which is co-owned by Conoco Phillips in the Gulf of Mexico.  This is the third Paleogene discovery made in the Gulf of Mexico since 2006.  Appraisal drilling will be required to determine the size and potential commerciality of the discovery.  It is good to see that BP is making discoveries such as these, it is just a shame that their name is mud in the Gulf of Mexico!

On the same day the group announced a number of other exploration updates.  There was an oil discovery at Pitu in the frontier deepwater of the Potiguar basin in Brazil.  The well is operated by Petrobas and BP holds a 40% stake.  At the Lontra oil and gas discovery in Angola a drill test recorded a flow rate of 39M cubic feet of gas and 2,500 barrels of condenstate a day which is a pretty good find.  BP only owns 30% of this discovery operated by Cobalt International Energy.  It was not all good news, however, as the Pitanga exploration well in the Camamu-Almada basin in offshore Brazil did not show any commercial quantities of oil and gas and BP will relinquish this block.  This will trigger a write-off of $220M related to the costs of drilling the well and a $850M write-off associated with the value of this block on acquisition which is clearly a blow.

As the share price seems to have done fairly well over the last few weeks I have decided that I would be more comfortable selling the shared before the court case is decided as I do not think there is a good enough upside for the risk that is involved and as I am sitting on a decent paper profit I  have decided to sell my holding here.

Naibu Global Finance Blog – Interim Results 2013

Naibu has now released their half year results for the year ending 2013.

naibuinterimincome


Once again, revenues were up across all product types with shoes increasing by £9.7M, mainly due to higher sales volumes and apparel up by £5.9M, which was a slightly slower rate than the other categories due to a timing difference in the delivery of sales orders which resulted in a strong showing in the first half of last year.  Cost of sales also increased partly due to the increased proportion of lower margin shoe sales and the increase of costs due to some of the shoes being manufactured by OEM suppliers due to the lack of the group’s own manufacturing capacity.  Selling and distribution expenses also increased, mainly due to an increase in amortisation expenses related to the store decoration subsidy for distributors’ shops, but admin expenses fell slightly due to the IPO costs incurred in 2012, to give a profit before tax £3M higher at £21.5M.  An increased tax bill then gave the overall profit for the period of £15.9M.

naibuinterimassets


When compared to the end point of last year, total assets at the end of the first half were up by £15.8M which was due to a £21.2M hike in trade and receivables and a £1.9M increase in inventories, somewhat mitigated by a £6.3M fall in the cash levels.   Liabilities did not change a great deal with a £1.5M fall in trade payables counteracted by small increases elsewhere, the largest of which was a £1.1M increase in tax payables.  This meant that net assets for the year were up an impressive £15.7M to £112.9M.

naibuinterimcash


Cash profits for the first six months were up by £3.9M but this was almost entirely swallowed up by a massive increase of £16.5M in trade receivables which, along with a £1.9M increase in inventories and a £1.5M decrease in payables meant that the cash flow after working capital considerations was a negative £2.2M, a fall of £6.5M on the same period of last year.  On top of this there were £4.3M of taxes paid out which meant that the overall cash outflow was £6.3M, £11.5M worse than last time, albeit last year did benefit from the £5.4M of share issue proceeds.   This is undeniably a bit disappointing but I hope it is due to a ramp up of orders.

It is claimed that trade receivable turnover days actually fell in the period so the huge increase is likely due to more orders (it remained high at 116 days).  The trade payable cycle did decrease, however, from 47 to 33 days.  The disparity from the 33 days the group takes to pay its payables and the 116 days that their customers take to pay Naibu is very clear and not a great state of affairs.

Although revenues for shoes are higher than apparel, the group actually made more profit on the clothing ranges (£8.1M compared to £7.8M, however both products are increasing profits).About 54% of the shoes sold by the group are manufactured internally with the rest of the shoes and all of the apparel being made externally.

Growth is continuing on the retail side of things and 104 new stores were opened since the end of last year.  The group are also releasing a new brand called “Nibo” based on a European fashion concept which will be launched in 2015.  One thing that Naibu does that in their opinion gives a competitive advantage is to provide a renovation subsidy so that their distributors can upgrade their retail stores to keep them looking new.

In the last report it was mentioned that the group was building new shoe production facilities in Western China but this has taken longer than was anticipated due to the changes in the political leadership in China.  The group has now signed an agreement with the government of Dazhu County in Sichuan province to purchase land use rights for 13.3 hectares to develop a Naibu industrial zone.  This will include R&D, manufacturing and logistics facilities.  As part of the investment, by mid-2015 there should be 12 new production lines in operation at this site.  The group will pay RMB60M for the rights but the total cost of the project is likely to rise to about RMB300M, which is quite a substantial investment.  The group have now completed their purchase of its new plant in Quangang for RMB 157M and the new production lines are expected to be operational by the end of this February which is a delay of two months.  This delay meant that the shoes will have to be sourced from OEM manufacturers at a lower margin to prevent any interruption to the supply chain.  Until the new production lines are up and running, the four existing lines will continue to produce shoes but the plant in Shishi was vacated because the lease expired (as was previously announced).

Going forward, the board expects to be challenged by continued inflation and increased competition but government urbanisation plans continue to provide more opportunities for sales.  It is clear that this half of the year was one of expansion for the group and although the delay in the construction of the new factory is a blow and is hurting margins, the investment is definitely needed.  The new industrial zone in the West of the country is an interesting development and should be good for the long term future of the group although it is likely to swallow up a lot of cash in the short to medium term.  The disparity between the average trade payable days and trade receivable days is a worry and the huge increase in trade payables is harming the cash flow but hopefully this is a signal that the business is growing rather than anything else.  The group has declared an interim dividend of 2p per share, which, when compared to the 4p at the end of last year equates to a yield of 7.7% which is a very good return.  Given the cash levels after the unfavourable movements in working capital, along with the capital commitments in the new industrial zone, however, it remains to be seen as to how sustainable this is.  Overall though, I think that there is a case for investment here and due to the fact that Naibu seems to be a bit further down the journey than Camkids, I have dipped my toe in here.

On 29th January, the group released a trading update covering the year to December 2013.  It was stated that results wold be in line with expectations and that during the year, revenues increased by 15%.  The move to the new production facility at Quangang is on track  to be completed by the end of February.  Nothing really to say here.

Naibu Global Finance Blog – Final Results 2012

Although listed on AIM and headquartered in Jersey, Naibu Global International is a Chinese company and operate exclusively in that country.  They design, manufacture and supply Naibu branded sport shoes and design and supply Naibu branded clothing and accessories.  The target market is students and young people between 12 and 35.  There are currently two factories with eight production lines and there are 3,040 stores across 21 Chinese provinces.  The business is split into two segments:  The design manufacture and sale of footwear comprises athletic and leisure footwear under the Naibu brand and the design and sale of apparel and accessories which are marketed under the Naibu brand but manufactured by an outsourced manufacturer.  When I have converted from RMB to GBP it is very rough and only so I could more easily understand the size of the company.

naibuincome


When compared to last year revenues are up strongly for both shoes and apparel as the group increased the number of branded stores by 170 to 3,040 and the group managed to increase unit sales price but materials and labour costs also increased along with R&D costs and subcontractor production costs (only the shoes are made by Naibu themselves).  This meant that Gross profit was up by RM47.8M to RM469.4M.  Admin costs are also up a fair amount to give a profit before tax RM15.3M higher at RM360.5M.  The big difference to last year is a RM33.4M hike in tax costs relating to the tax that the Chinese government levies on dividends and as a consequence of this profit for the year was down RM18.1M to RM265.1M, which in terms that I can understand translates roughly to a £1.8M fall to £26.5M.

naibuassets


Overall, assets increased by about £27.3M during the year, driven by a £5.6M advance to suppliers which is apparently the deposit paid to suppliers to establish a “cooperation relationship” – interesting; a £5.1M increase in prepayments (relating to prepayments of store renovation for distributors) and a hefty £16.6M hike in cash levels which was slightly mitigated by a £1.4M fall in inventories.  Deposits relate to deposits paid for the acquisition of a factory and staff hostel from related parties.  This amount was transferred to amount due from related parties this year.  Surprisingly, liabilities fell during the period by £4.8M driven almost entirely by a £4.8M fall in trade payables.  There were no intangible assets so overall net tangible assets increased by an impressive £32M to £97.2M.

naibucash


At £36.5M, cash profits were up on last year.  An increase in receivables (average debtor days increased from 103 to 121 days which seems like a lot but I guess could be the norm for China) and a decrease in payables, slightly mitigated by a strong control on inventories,  took the net cash from operations down to £24.3M but this was still £2.2M up on last year.  The largest expenditure was tax which increased by £2.9M to £9.7M and the refurbishment of property which was £3.6M that did not occur last year.  The group gained a cash inflow of £5.4M from share issues which gave a cash flow of £16.6M for the year, £1.3M up on last year.  This is a strong cash generation and would still have been fairly substantial without the new share issue, although it would have been lower than last year.

When looking at this company as investment, one of the most relevant factors is that it operates in China which is still under communist control.  There is a warning in the annual report that although the political landscape is currently stable, in the future there may be changes introduced affecting the way companies do business and in particular their ownership structure – something to bear in mind.  Another peculiarity of doing business in China is that regulations require to transfer 10% of its profit after tax to the statutory reserve until the reserve balance reaches 50% of the respective registered capital.  This reserve is therefore not available to be distributed to shareholders.

Although profits before tax were up, margins were eroded somewhat this year due to increased R&D and advertising together with the costs related to the IPO.  The group is also investing in production capacity.  Currently they have 8 ageing production lines in two factories in Fujian province.  The lease on one of the plants is due to expire at the end of the year and the group are negotiating in order to acquire a plant in Quangang where 8 new production lines will be created.  There is not expected to be any effect on production while the change-over takes place but the timings seem quite tight.  They are also in negotiations to purchase a factory in Sichuan province to provide 12 more production lines.  This is taking longer than expected due to the political changes in the country but should be completed by the end of 2014 and will give the group a much larger capacity and a foothold in Central and Western China.

Although shoes account for a larger portion of revenues, the profits are similar for both segments and are indeed growing at a quicker rate for apparel and accessories.   The group have two customers that contributed over 10% of group revenues which represents a bit of a risk but it does seem as though the group could cope with the loss of one of these clients.  One thing to note is that nearly half (46.75%) of the shares are owned by the founder Huoyan Lin with the only other director to own any shares being Giles Elliott who has picked up a measly 8,065.  During the year Kenny Law resigned as the CFO to return to Singapore.  Ms. Zhen Li was announced as his successor.

So, profit for the year was up about £1.5M before tax but due to the tax paid on dividend payments the net profit for the year was down by £1.8M.  Net assets showed a very healthy increase, mainly due to a big hike in cash levels and a reduction in trade payables.  Not including the cash flow from new shares, the cash inflow for the year fell by £4.1M due to increased tax and refurbishments to their property but it was still fairly healthy at £11.2M.  At the year end, the group announced its maiden dividend of 4p per share.  At the current share price, this represents a tasty yield of 5.3% and marks the start of further dividend announcements in future, along with the proposed introduction of an interim dividend.  At current share price the P/E ratio is a measly 1.5 reducing to 1.4 next year.  There is also not debt at the company and I think that they are worth a buy despite the potential pitfalls of investing in China.  Before I make my decision, however, I will take a look at another similar company, Camkids.

Sainsbury Finance Blog – Interim Results 2014

Sainsbury have now released their interim results for the year ending 2014.

sainsburyinterim2014income

Revenues for the half year increased by an impressive £524M year on year.  Obviously cost of sales also increased but at a slower rate so gross profit was up by £62M.  Admin expenses were actually slightly lower than last year but a lower profit on property sales was not enough to cause a reduction in operating profit, with it being £33M up.  Finance costs were not that different from last year and a slightly higher tax bill meant that the profit for the period was £29M higher than last year at £340M.  There were a number of one off items that affected profits.  These included a £158M service credit due to the closure of the pension scheme to future accrual; an impairment of £92M for write downs where the group no longer intend to build supermarkets following a review; costs of £17M in relation to the ongoing purchase of the bank and cost of £13M as a result of a provision for a commercial item (this might be related to the legal challenge with Tesco’s own brand products.  In the second half the group expects one-off costs including £11M of costs due to the closure of the defined benefit pension scheme, £25M for the bank to transfer to a new platform and an unknown amount of one off costs relating to the purchase of the bank.

sainsburyinterim2014assets

Overall total assets at the half year point were £213M higher than at the end of last year.  There were not actually that many huge changes but some of the largest increases were seen under trade & receivables (up £75M); cash (up £86M) and inventories, up £75M.  These were counteracted by a number of small falls with the largest being a £48M reduction in the value of derivative financial assets.  Total liabilities, however, were also higher than at the end of last year with a few big increases – trade and payables increased by more than receivables, up £143M, pension obligations increased by £77M and total borrowings were up by £53M.  There were no large falls in liabilities so total liabilities increased by £289M which gave a fall in net tangible assets of £80M to £5.587M.  This is rather disappointing but I try not to get too excited about half year balance sheets as results can sometimes be weighted to the second half of the year.

tescointerim14cash

Cash profits were slightly higher than during the same period of last year before a big increase in payables was almost exactly counteracted by increases in receivables and inventories.  The movements were more favourable than last year and cash from operations was £58M better than last year at £695M.  A higher tax payment took its toll on net operating cash, however, and this was up by a more modest £36M at £566M.  Once again, this was almost entirely eaten up by capital expenditure which was £152M lower at £457M before £143M received from store sale and leaseback operations meant that cash before financing was £243M, £189M up from last time.  There was then a net £87M in new borrowings counteracted by £225M of dividend payment but the cash change in at the end of the half was a decent £93M.  When it is considered that store sales accounted for £143M and new borrowings £87M, this is not so swish.

The joint ventures are not making a great deal of money with underlying profits at the bank £12M, exactly the same as last year and the same is the case with the property joint venture with underlying profits of £8M also the same as in the first half of last year.   After the effects of one off items at the bank the actual profits were only £3M in the first half.

For the last few years there has been an ongoing legal case between HM customs and Amina, the company that administers the Nectar scheme regarding the accounting for VAT on the redemption of Nectar points in store.  In June the court ruled in favour of Amina thereby potentially enabling Sainsbury to recover some historic VAT payments and the group are currently in discussion with HM customs regarding this.

Once again Sainsbury recorded quarterly sales growth, the 35th consecutive quarter that they have done so, driven by strong performances in own-brand, non-food, convenience and online food along with favourable summer weather.  Total sales during the half year excluding fuel were up 4% with a 1.4% increase in like for like sales (all the more impressive when it is considered that the comparison last year contains the Olympics and Queen’s diamond jubilee).  Like for like sales growth in the second half is expected to be somewhat lower due to a strong comparable last year.  Underlying profit was even more impressive, up by 7%.  Non-food and the own brand food are increasing sales at over twice the rate of branded groceries with the premium own brand showing double digit growth.  The basics range is being relaunched after it recorded a marginal sales decline during the period which should help sales there.  The convenience business is providing growth of 20% year on year with two new stores opening a week.  The other driver of growth is online groceries which increased sales at over 15% and now turns over more than £1B and the group have been awarded online retailer of the year – I am not sure how much margin there is in the online grocery business though.

As mentioned above the profits at the bank were flat but the group is intending to build the bank into a high trust and ethical bank.  The timing is pretty good as there is likely to be a gap in the market following the well-publicised problems at the Co-Op bank.  A new pet insurance product was launched during the period and Travel Money increased sales by 20% over the same period of last year.  The group are on track to take on full ownership of the bank in early 2014 with the transition expected to take three years.  There will clearly be some associated costs involved here but hopefully long term this will be a good move for the group.

There are a number of new areas that Sainsbury is moving into.  They are building a new mobile network in a joint venture with Vodafone offering customers double Nectar points on their grocery and fuel spend in Sainsbury as a sweetener.  A video on demand service was launched in April that will shortly give customers the ability to buy or rent films via a download service.  These two new joint ventures made a £2M loss due to start-up costs. The other main new business is health services for customers with in store pharmacies, GP offices and dental surgeries.  In addition, the group also opened their fourth outpatient pharmacy at King’s College Hospital with more to come over the next few years.

There are continued attempts to improve operational efficiency with a new warehouse management system being rolled out that increased productivity by nearly 10% and improved pick accuracy.  The group have also added a large clothing facility near Bedford and a dedicated convenience store depot in South London to help that growing market.

The group has decided to take Tesco to court after the advertising standards authority failed to take the action Sainsbury were looking for regarding the fact that in the group’s view the price comparison between Tesco own brand and Sainsbury own brand was not fare due to it not being the same with regards to provenance and quality.  I am not sure if Sainsbury are really looking to get anything out of this other than to draw attention to how ace Sainsbury own brand is!

So, revenues were up by about half a billion pounds and profits were up £29M in the period despite lower property profits.  Net assets were down £76M on the end of last year which is almost exactly the amount by which the pension obligations increased with payables and loans also increasing.  The cash income during the period was £93M which, although better than last year, was still a bit poor considering the group gained £143M of cash from store sales and there were new borrowings totalling £87M.  It is clear that Sainsbury are diversifying into a number of different business and the purchase of the bank is a sign of intent, albeit one that will costs a bit in the short term.  At £2.187B net debt was just £25M higher than at the year end point but this is expected to increase to £2.5B by the end of the year, partly due to the bank purchase.  The interim dividend was increased by 0.2p to 5p which at the current share price represents an annual yield of 4.1% which is pretty decent given the lack of risk here.  There is no doubt that Sainsbury has been the big winner in the race for market share but Tesco are making changes that put it in more direct competition from Sainsbury which is something to look out for.  Overall I consider Sainsbury to be worth holding on to for now.

On 8th January the group released a statement covering the quarter to December.  It was announced that total sales (excluding fuel) were up by 2.5% but like for like sales were only up 0.2% as weak trading in October and November was counteracted by a strong December and Christmas.  Growth came from own branded products, with taste the difference sales up 10%; convenience sales, up 18% and online sales, up 10%.  Non-food also grew quickly with Tableware up 25% and Gifting up 30%.  The group sold more than 250,000 Christmas Jumpers!  It was also another quarter of expansion with 6 new supermarkets, 4 extensions and 19 new convenience stores.  Overall there is no denying that this is quite a disappointing update and Sainsbury only just continued its theme of consecutive quarters of like for like growth.

 On 29th January, Sainsbury dropped the bombshell that long standing CEO Justin King had decided to step down in July this year.  He will be replaced by the current Commercial Director, Mike Coupe.  Mike was appointed commercial director in 2010 and was responsible for the trading, marketing, supply chain, IT and online.  He has been a member of the board since 2004 when he joined as Trading Director.  Prior to joining Sainsbury he was a board director of Big Food PLC and a Managing Director of Iceland food stores.  Justin has waived his cash severance payment, which could potentially have been worth up to £1.7M.  He had been CEO for the past ten years and is credited with turning round the fortunes of a company that was in pretty bad shape when he took over.  It is undoubted that Sainsbury will be losing a very charismatic and capable CEO and I hope that Mike will be able to fill his shoes.

On 18th March, Sainsbury released an update covering Q4 trading.  Like for like sales in the quarter were down 3.1%, the first quarterly fall for many years.  The market is currently growing at its slowest rate since 2005, partly due to lower food inflation.  Own branded products now account for 51% of sales, compared to 47% this time last year so the lower value of those would have affected sales.  Q4 this year was also battling strong comparisons last year as Sainsbury received a boost as the horsemeat scandal hit some of its competitors.  Also, the late fall of Easter and Mother’s Day, along with the terrible weather are also thought to have an effect.  Sainsbury maintained market share at 17%.

General merchandise fared well, with sales of menswear up 23%.  The other two growth areas were convenience, up 15% and online, up 6%, which is a bit of a slow down on recent numbers due patly to reduced marketing before the new website is launched next month.  There is no doubt that the first fall in sales for many years is a big disappointment but I do feel that there were a number of one-off factors this quarter.  It will be interesting to see how Q1 fares considering the timing of Easter.  It is encouraging to see Sainsbury maintain market share but the share price has been hammered in recent weeks due to the announcement of Morisson’s that they will be lowering prices to compete with Lidl and Aldi.  It seems that the two German discounters are not affecting the group in the same way that they have their competitors but if the other large UK supermarkets start reducing prices, this could have an adverse affect on Sainsbury.  I felt the fall in share price was overdone and topped up some more shares but only time will tell if this was a wise decision…

Tesco Finance Blog – Interim Results 2014

Tesco has now released their half year results for the year ending 2014.

tescointerim14income

Revenues were up with Asian revenue in particular doing well, up £365M in the half year.  UK revenues were also up, increasing by £365M.  Europe fared less well, up £40M and bank revenues actually fell in the period, down by £16M.  The increase in cost of sales dwarfed the increased revenues which meant that gross profit fell marginally on last year.  Higher admin expenses and a fall in profit from property, due mainly to the slow-down in the sale and leaseback programme, drove the operating profit down  by a hefty £438M.  A slightly reduced finance cost (due to better average working capital and the lack of pre-debt financing costs that occurred last year) and a much lower tax bill were counteracted by increased losses from discontinued items (which now includes the Chinese business) meant that the profit for the half year was £415M down at £820M.  Underlying profit was down by over 7% to £1.466B.

tescointerim14assets

Total assets increased when compared to the end of last year driven by a £583M increase in property plant and equipment, a total of £868M increase in loans to customers and a £2.434B increase in the value of assets held for sale as the US and Chinese businesses were moved to this category following the agreement with China Resources Enterprise.  There were a number of large falls in the asset base too with a £639M decrease in intangible assets, a £1.686B fall in the value of investment property which is related to the fact that malls to the value of £1.623B were removed from investment property and reclassified as property, plant and equipment because it was decided that the level of service provided to the tenants was significant, and a £764M fall in the cash levels.

Liabilities also increased during the year with a £1.034B increase in liabilities held for sale, again following the agreement in China the liabilities of the Chinese subsidiary were moved here.  There was also a £253M increase in customer deposits and a nasty looking £604M increase in pension obligations due mainly to a reduction in real corporate bond yields.  This led to a net asset figure almost a billion pounds lower than the end of last year but taking out that fall in intangible assets, net tangible assets were down £323M to £11.976B.

tescointerim14cash

The cash profits were up £179M on the first half of last year and a large increase in trade payables and customer deposits in the bank was counteracted by nearly a billion pounds in bank loan increases to customers and a 335M increase in trade receivables.  This meant that cash from operations was £81M higher at £1.741B.  A substantial amount of increasing interest paid and a higher tax payment, however, meant that the net cash from operations was £102M lower than the first half of last year at £1.142B, although without the effect of the bank cash flows, this would have been higher than in the first half of last year.  The main sink for the cash was the £1.163B spent on property, plant and equipment (more than the cash flow from operations) and when compared to the first half of last year, the biggest differences were the £697M fall in proceeds from the sale of property, plant and equipment due to the slow down of the sale and leaseback of stores; and the £618M swing from proceeds received from investments to a net increase in investments.  This caused the cash flow before financing items to be over £1B worse than the same period of last year and an outflow of £174M. 

There was then a net increase in borrowings of £412M counteracted by £815M spent on dividends.  The net result was a cash outflow for the period of £553M compared to an inflow of nearly £1B last time round.  This is clearly not good and a net cash from operations that does not even cover capital expenditure is something that will need to be turned around but when it is compared to last year and the net difference of new borrowings, sales of property and sales of investments are discounted, the result is broadly the same.

On 1st October the group entered into definitive agreements with China Resources Ltd to combine their retail operations into a joint venture.  Tesco will only have a 20% stake in the resulting group but it will apparently be the largest retail store in China.  The deal will cost Tesco £265M initially and another £80M on the one year anniversary.  Also, during the period the group agreed the sale of the majority of the US operations to YFE holdings.  YFE will acquire 150 stores and the Riverside distribution and production facilities and stores not involved in the transaction will be closed.  As part of the deal, Tesco will also make a loan to the new business.

In the last annual report, the group set out their intention to radically overhaul the UK business.  One of the largest changes was the improvement in quality of many own-brand products, another change has been the refresh of many stores around the country.  The group are also looking to drive online sales by introducing the Hudl which is a tablet computer created by Tesco that offers instant access to all of Tesco’s digital products by use of pre-installed aps along with the usual Google offerings .  Three new formatted Extra stores were introduced during the period, bringing together the changes Tesco have made to their general merchandise offering along with casual dining restaurants (presumably Giraffe and Harris and Hoole).  These three stores are currently trading ahead of expectations which looks like a good sign.

A lot of the work the group has done on the UK business is to make investments in the provenance of their products and fresh chicken is now all UK sourced and ready meal beef is now sourced from the UK and Ireland.  Investments have also been made in the quality of fresh food.  This seems to be a response to Sainsbury running away with the UK market share stats, and the horse meat scandal.  This has led to a 1% increase in like for like food sales in the second quarter.  Overall UK trading profit was up by 1.5% in the first half at £1.131B.  As well as fresh food, the group has substantially completed the re-formulation and re-packaging of their own brand products and over 1,750 new products were introduced.  It is not just their products that have been targeted by Tesco, they have also refurbished many stores and invested in staff training. These changes do seem to be having an effect on customer perception as customer viewpoint scores were up by 5% in perceptions of customer service.

Tesco have been re-arranging the products they sell in general merchandise by moving away from consumer electronics and although this process has started, it is thought that it will continue well into next year and this has caused a slight drag on like-for-like sales.  The group has been moving more towards homeware, cooking & dining and celebration products that are more resilient to the threat of online trading.  Clothing has also performed rather well and sales improved in the second quarter.  Although there was a slow-down of new store openings, more is being put into convenience stores with 70 new openings during the period.  As touched on previously, the new Extra stores are designed to be destinations in themselves including the Tesco owned casual dining and coffee shop brands.  There is also the intention to generate rental income from other operators.  Scan as You shop has been introduced to some of the larger stores which allows the group to invest man hours into other areas of the store.

Although sales and revenue in Asia both increased compared to the first half of last year, profits actually fell 7.4% to £314M.  Performance for the first half was held back by the regulatory restrictions introduced in South Korea which affected profits by £40M.  Another issue is that the Thai economy fell into recession during the period which affected performance there and the measures by the Thai government to try and stimulate the economy for offering finance for big ticket items such as cars has also had a knock on detrimental effect on the food industry.  As if this wasn’t enough, Tesco has also been hit by increased competition in the Thai convenience sector.  The group have taken some steps to address the poor performance in Thailand, one of which was to remarket the “Clubpack” range of bulk buy products marketed to small traders who shop with Tesco.  Despite these issues, Thailand remains an important and profitable market for the group.

Market conditions in Malaysia were relatively stable but the group has suffered lower sales growth which is being blamed on lower consumer confidence following the recent elections there.  During the period the group launched home shopping in the country which is being received well by customers.  A lot of the income from Asia comes from malls and Tesco is one of the largest mall operators in Asia.  There was 700K square feet of new space opened in Asia and much of this was concentrated in South Korea and Thailand.

In Europe, sales increased by 1.2% but this was due to exchange rate differences and at constant rates sales actually fell by 3.1% and like for like sales fared even worse, down by 5%.  Trading Profit in the region crashed, down by nearly 71% to be just £55M.  This was mainly due to the continued economic problems affecting customer confidence and the continued preference for smaller convenience format stores.  The worst affected country was Turkey where the level of losses increased significantly due to their exposure to larger format stores.  In response, the group have focused the business on driving growth in their heartland around Izmir which is apparently leading to an operational improvement.  Tesco are also introducing home shopping in Turkey in 2014.  Although Turkey was worst hit, profits fell in all European regions.  The fall in Polish profits was due to increased investment in that country, Ireland slipped back into recession during the period which drove customers to discounters.  200k square feet was added in Europe during the half year and apart from three previously committed hypermarkets in Poland, all were convenience style stores.

As with other sectors, the bank profits were also down, this time by 6.4%.  This was due to the legacy insurance distribution agreement last year (that was worth £17M in the first half of last year) and fair value releases.  Without these two effects the profit would actually have increased by 21%.  As has been seen under the asset table, customer lending increased strongly with loans up 11% and card balances up 16% since the year end.  The mortgage product also did well with balances growing to £500M.  It is expected that current accounts will be launched in next year.  The motor insurance business suffered some headwind during the period with the group sticking to a disciplined approach to pricing which contributed to a 5% reduction in motor policies since the year end.  Home insurance was re-launched during the period and new business grew by 40%.  Despite this overall insurance customer numbers fell by 4% to 1.8M. 

Going forward the group have made decent progress improving perceptions in the UK and investments made in the international business are apparently feeding through to an improved trading performance in the second half.  Challenging economic conditions remain in Europe, however, which is holding back consumer confidence and causing a drag on Tesco’s results.

Profits have fallen across every single one of the group’s territories with the best performing countries being Malaysia, UK and Hungary with profits falling by 0.4%, 0.5% and 0.8% respectively.  The worst performances were seen in Turkey, down 12.8%; Czech Republic, down 6.9% and Poland, down 6.4%.  Possibly just as disappointing is that Hungary and Malaysia actually showed profit growth in Q1 only for poor Q2 figures to drag profits down.

So, profits were down considerably during the period due to operational issues in many of the group’s markets and exacerbated by the slow-down in the sale and lease back programme.  Net tangible assets also fell, but this is accounted for by the increase in the pension deficit.  Cash flow was also negative with operating cash flows not covering both capital expenditure and dividend payment, even when the increase in bank loans to customers is taken into account and net debt at the end of the period increased by £443M to £7.04B. There is not much good news here at all really and the problems facing Tesco are probably a little harsher than I originally thought.  The one slight ray of light is that the investment in the UK business seems to be starting to bear fruit and the agreements in the US and China should help in some difficult territories although I still find it disappointing that the group has had to exit some of the largest markets in the world.  The interim dividend remained unchanged on last year and the yield currently stands at a solid 4.1%.  I am going to hold on to the final results to see if any progress is made in the second half.

On the 4th December Tesco released a statement covering trading in Q3 of this year.  Once again it is a disappointing update and like for like sales declined in all countries.  The best performers (relatively speaking at least) were Poland, down by less than 1%, Malaysia, down by 1.1% and the UK, down by 1.5%.  Although like for like sales in Hungary were recorded as only falling by 1.3% this was discounting the sales of tobacco which was banned from being sold in large retailers during the period.  The worst performers were Ireland, down by 8.1% due to very tough retail conditions and increased competition – Tesco have just introduced price promise into the country in an attempt to stem the tide; Thailand, down by 6.9% due to increasingly tough conditions for their customers and Slovakia, down by 5.7%.  The Korean business continued to be affected the new regulations in that country and sales there fell by 4.8%.  The measures introduced in Turkey and Poland seem to be slowing down the decrease in sales, having fallen 3.5% and 0.7% respectively.

Work is continuing to reposition Tesco in the UK market and some examples during the quarter were the re-launch of the Tesco Finest range; the individual tailoring of the Tesco Express stores to the needs of the local areas and the continuing refresh of the older stores.  The realignment of the general merchandise range to higher margin products is also ongoing.  The UK results were somewhat held back by this work in the short term.  One success story is the sales of the Hudl tablet device which have been very strong at over 300,000 units which is above management expectations.  The tablets have also attracted some favourable reviews.  The bank had a decent performance as sales increased just under 1% due to increases in interest income from a strong lending performance being mitigated somewhat by a reduced fee income across the insurance business.  The group also confirmed that the sale of the US business to Yucaipa had been completed.  Overall then, this was a disappointing update with the international performance being particularly poor in some regions but it was not entirely unexpected.

On 21st March, the group announced that they had completed a joint venture with Tata in India.  The joint venture, named Trent Hypermarket Ltd will operate under the Star Bazaar and Star Daily banners and will initially have 12 stores. Tesco’s investment will be around £85M.

On 4th April, the group announced that Chief Financial Officer, Laurie McIlwee was stepping down and resigning from the company.  He had been in the post for 14 years so perhaps felt it was time to move on.  It still does not bode well for the financial results this year, however.

Hansard Global Finance Blog – Full Year 2013

Hansard Global has now released their final results for the year ending 2013.  The group make money in a number of ways.  One of the most obvious are the fees charged for policy administration services, investment management services and other services related to the admin of investment contracts.  This is the main source of income for the group and it is generally rather fixed in nature.  Another source of income is the commission received from fund houses with which investments are held.  Investment income includes dividends and interest along with realised gains and losses on investments as well as unrealised gains and losses.  Only about 30% of revenues are based on the value of assets under administration.

There were a number of terms that I was unfamiliar with when starting the analysis of this company.  One was Frictional Costs which are the additional taxation and investment costs incurred by shareholders through investing the required capital in the company rather than directly.  New business strain are the costs involved in acquiring new business (such as commission, payments to intermediaries and expenses) affecting the insurance company’s financial position at that point and where all of the income from that new business has not yet been received.  To begin with strain may be created where cash outflows exceed inflows.  Origination costs are expenses related to the procurement and processing of new business written including a share of overheads.  Value of In-force covered business (VIF) is the present value of expected future shareholder profits, less the present value cost of holding capital required to support the in-force business.

hansardincome

Compared to last year there has been a £2.1M increase in contract fee income and a £400K hike in fund management charges.  A decrease in interest income is exactly counteracted by an identical increase in dividend income.  Unfortunately there was a £10.2M loss on the realisation of investments which was £7.9M worse than last year but this was completely dwarfed by a favourable £80.5M movement in unrealised investment value compared to a £148.6M paper loss last year.  This has caused the income to be a massive £223.5M higher at £132.7M before a £73.4M loss relating to changes in provisions for investment contract liabilities comes into play.

As far as other costs are concerned, employee costs were £700K lower than last year due to a smaller work force but almost every other cost was up with a £1.8M increase in origination cost amortisation, a £1.2M increase in litigation fees and settlements and a £1M hike in other admin costs, which included £600K of provisions for policy fees that are not expected to be collected due to reductions in asset values, £400K of which related to costs following the closure of Hansard Europe to new business.  This all meant that after tax the profit for the year was down £800K to £10.4M.  Discounting the one-off litigation settlements and discontinued activities, however, profit was £12.7M, up by £1.6M on last year.

hansardassets

Overall the value of investments fell by £5.7M to £1.050B as a £14.6M increase in investments in collective investment schemes was counteracted by a £11.7M fall in fixed income securities, a £5.4M reduction in equities and a £3.2M reduction in deposits and money market funds.  The investments in collective investment schemes make up by far the largest chunk of investments and £22.8M of these investments (4.7M more than last year) were classified as level 2 which means the value of the investments are determined not just by quoted prices but also other observable inputs are used to determine value.  During the year £10.9M of assets were re-classified as having a value of zero which is clearly not great, although better than last year when £29.3M of assets were classified as having no value.  As far as non-investment assets are concerned, there was a fall in contract fees receivable and outstanding investment trades but this was more than counteracted by a £9.8M increase in deferred origination costs and a £3.1M hike in cash levels.  Origination costs are all expenses related to gaining new contracts (commission etc) and they are deferred for the length of the contract in question and amortised throughout the life of the contract.  The small increase in other debtors was due to the company already paying for a new freehold property (£500K in all).

Investment contracts are unit linked contracts and the liabilities are measured on a fair value basis.  Compared to last year there was a small fall in liabilities tied up in investment contracts as some deductions from the contracts took place during the year but every other liability increased.  The largest increase was in deferred income reserve presumably as more income is received for future investment admin, but there were also comparatively large increases in amounts due to contract holders, commission payable and other accruals.  The result of this was that net assets fell by £5.1M to £39.8M which was rather disappointing.

hansardcash

Cash profits were at a similar level to last year but increases in the deferred income reserve and creditors pushed this higher before a decrease in financial liabilities were broadly counteracted by a decrease in financial liabilities to make the cash generated from operations £18.9M, £13.6M up from last year mainly due to the increase in creditors and a more favourable distribution of financial assets and liabilities.  The largest change in non-operating activities was the £3.6M fall in dividend payments to leave a positive cash flow of £2.9M compared to an outflow of £14.3M last year.

Apart from the financial items mentioned above, the group also use something called European Embedded Value (EEV) to attempt to estimate the value of the shareholders’ interest in the group.  It is the value to shareholders of the net assets plus the expected future profits on in-force business from a life assurance business.  The EEV comprises net worth and the Value in force (VIF is future profits from business in force at the valuation date).  It excludes the value of any future new business that the group may write after the valuation date and all results are calculated net of corporation tax.  The idea is that the embedded value reported on one year will emerge as cash in future years.

hansardeevprofit

So, EEV profit is listed at £17M, a whole £30.7M higher than last year.  This sounds good but to me there seems like there are a lot of fairly abstract assumptions here.  New business contribution is fairly straightforward, being the value of new business written during the year at the point of sale.  The expected return on business is based on assumptions made at the start of the period to convert VFP to Net Worth in the year and the time value of both existing business and non-market risk.  Experience Variances arise where the actual experience differs from that assumed in the last year’s EEV.  These seem to be constantly negative for the past two years and the bulk of the negative figure this year comes from the one-off expense of £3.3M that has arisen from action taken to conclude litigation.  Operating Assumption Changes reflect changes in management’s view of the behaviour of the existing business and the negative value is predominantly due to premium reductions & underpayments; and partial encashments.  The Expected Return on Net Worth reflects the anticipated increase in shareholder assets during the period due to the time value of money.

Model Changes reflected the refinement in the approach to the selection of discount rates, moving from a single rated average rate to an approach which applies the actual currency denominated risk-free rate by term to liabilities.  The result was a small increase in VFP.  Conversely the simplification to modelling unit pricing margins and certain foreign exchange margins reduced VFP which had the effect of the overall £2.6M reduction seen above.  The impact of market and economic conditions led to the £7.9M increase in investment return variances which was driven by the performance of investments chosen by policy holders.  The Economic Assumption Changes reflected reduction in government bond yields for the currencies in which the group is exposed and the revaluation of policy holder assets that are subject to restrictions on normal pricing.

The EEV balance sheet shows that EEV assets were £225.7, a small increase on the year before.  The new business margin for the year was 12%, an increase from the 9.6% last year primarily due to the change in mix of sales towards higher margin regular premium business.  The average break-even point for new business written during the year was just 2 years, reduced from 2.6 years and again reflecting the change in mix to regular premium business.

The assets under administration at the year-end were £1.028B, £5.7M less than last year, mainly due to increased withdrawals.  Due to the financial crisis and increased regulation meaning that some asset classes are no longer suitable to be held by retail investors, the group had to write down assets by the tune of £16M.  This is much less than last year, but still quite a large amount.  The net asset value per share is 32.5p, which is a very small drop from the 32.7p recorded last year.

As touched on before, the group is fighting a number of writs from policy holders who are unhappy at the performance of their investments.  Despite Hansard not offering any investment advice themselves and the group allowing the investors to pick their own investments the group are settling some of the claims for £300K.  There are still £3.9M worth of claims outstanding but this is a vast improvement over the £11M of claims outstanding last year.  No provisions have been made for these claims as the group suggest there is no merit in them.

As touched on previously, the group has decided to close Hansard Europe, based in Ireland, to new business.   This decision was taken due to the long term decreased prospects in the Eurozone, and reading between the lines it seems that the legal challenges that the group has been facing in Europe has had an effect on this decision.  They will now be concentrating on emerging markets.  Next year the group expects to make a number of Irish staff members redundant which will create savings of £400K going forward

As Hansard provides unit-linked contracts only, much of the surplus cash can be distributed to shareholders but conditions imposed by the Central Bank or Ireland as a result of the implementation of the revised operating model have the effect of delaying dividend distributions from the subsidiary until such a time that the operating model is fully implemented and the legal cases the group faces are concluded.  Currently the amount of capital the group needs to keep back to cover the regulatory requirements is £12.8M.  Of this value £9.3M is related to the additional required capital following the closure of Hansard Europe to new business and it is thought that this will be constrained for three years. 

Also touched on briefly above is the new regulatory environment facing all financial service groups by the EU and management expect the implementation of Solvency II, FATCA and other legislation to tie up a significant amount of the group’s resources over the next years, which is clearly not a good sign. 

New business flows this year were 15% ahead of last year and represented a record amount since the business was floated. It should be mentioned, however, that the amount the group spent on obtaining new business rose £2.7M to £28.8M.  It is still impressive, however, when the difficulties the group faced in Latin America and Europe are taken into account and it is in the Far East that the group has been most successful.  Although regular new premiums did well, the value of new single premiums fell by nearly 37% due to the difficulties in Europe and the closure of Hansard Europe to new business.  Overall, the present value of new business premiums were split as follows:

Far East premiums were £114.3M, up 65%; Latin America is £30.6M, down by 18%; EU is £26.3M, down by 44% and the rest of the world was valued at £17.5M, down by 23%.

The Online system now accounts for 90% of new business compared to 60% in the previous year.  The system is an administration tool used by intermediaries to make it easier for customers to invest in Hansard’s products.

Overall then, this seems like quite a mixed set of results.  Although profits were down, underlying profits before the litigation settlements are taken into account were actually up and the cash flow certainly seems to have improved over last year.  It seems the assets under administration did ok, despite quite a few withdrawals and the EEV is also up on last year.  There are certainly some headwinds, however.  The only region where value increased was the Far East and the closure of Hansard Europe to new business is a bit of a blow.  Also, the spectre of litigation is still hanging over the group, although this is much improved since last year.

At the current share price, the P/E ratio is 13.7, which is predicted to fall to 12.6 next year which is probably about right given the headwinds facing the group.  The group announced a final dividend that was nearly half that of last year but at the current share price the yield is now 7.7% which, if sustainable is rather impressive.  The major problem I think I have with this company, however, is that I just don’t really understand it.  Reading the annual report requires some sort of financial dictionary to get anything out of it and I am unsure how to value the company or which of the numerous measures I should be using to determine whether they are doing well.  For this reason, despite the (falling) dividend yield I may look to exit if an opportunity presents itself.  Until that time I will still attempt to cover the group in this blog, however.

On 8th November the group released an interim management statement covering Q1 2014.  New business premiums for the international business increased by 4.2% over the first quarter of last year but regular premium flows of £27.8M were lower than the £28.4M received last year.  Single premium flows increased on the same period, however.  The group apparently generated strong cashflows during the period but decreases in the capital market values caused the value of both policy holder assets and embedded value to reduce on the end of last quarter.  The real bad news was the collapse of a large distributor for the group which will have the effect of reducing new business next quarter.

The plans to move the admin processes from Ireland to the Isle of Man following the closure of Hansard Europe to new business seems to be progressing on target and all admin processes have already been transferred and all affected personnel have either been made redundant or will be before the end of the calender year.  Hansard has taken a £300K hit to implement this and is not expecting any future costs.  There are still a number of writs totalling £3.9M outstanding and there have also been a number of customer complaints that may become future litigation.  EEV has been hit because oft he decreases in major capital market levels in the quarter, which is another blow.  The value of new business seems to have reversed the trend of last year with Far East premiums falling and Latin America and European premiums increasing.  Assets under administration fell to £1B from £1.048B.  Overall this is not a good update, the group seem to be suffering a number of headwinds, in the shore term the most concerning is the failure of a major distributor.  I am struggling to see any potential upside this year and may up my attempts at a withdrawal here.  A good opportunity to come out with a profit did not occur here but I am getting very nervous about prospects so I am out.

 On the 27th January the group gave a statement regarding new business for the first half of the year.  New business fell by 24% on the same period of last year due to the cessation of a large distribution relationship in the Far East.  H2 is also expected to come in significantly under the same period of last year so full year results are likely to be pretty dire.  The one bit of good news is that they will keep the dividend payment.  Having sold out last week (lucky timing rather than anything else) I no longer have a position here.  I must say I am quite pleased as the prospect of doing another write-up was pretty daunting.  The bottom line is I don’t really understand this business and I should not have taken a position here in the first place.  I have left with a bit of a loss but this will probably be my last update on Hansard.

Braemar Shipping Finance blog – Interim 2014

Braemar Shipping has now released their interim results for the year ending 2014.

braemarinterimincome2014


There was quite a difference in fortunes for the separate sectors as the Technical and Logistics business both increased revenues but Shipbroking revenues fell by more than £5M and Environmental revenues fell by nearly £14M, due to the end of the contract for the Rena clean up.  The technical division is now the most important by revenue taking over from the traditional revenue source of shipbroking.  Overall revenues fell by £13.2M (although revenues actually increased by 3% if the Rena project was taken out of the equation) but cost of sales also fell to give a gross profit £4.2M lower than in the first six months of last year.  An improvement in operating costs and lower amortisation (due to some assets from previous acquisitions being fully amortised) meant that operating profit was down £846K but a lower interest on the dwindling cash and a share of joint venture profit that more than halved were counteracted by a fall in tax paid to give a profit for the half year of £3.2M, down by £528K on the same period of last year.  Disappointing, but not unexpected given the end of the Rena contract.

braemarinterimassets2014


Overall assets collapsed by £11.2M from the end of last year which was almost entirely driven by a £16.2M fall in cash levels, somewhat mitigated by a £5.8M increase in trade receivables.  Thankfully liabilities also fell as trade and payables were down £9.7M which meant that net tangible assets fell by £1.3M to £36.5M.

braemarinterimcash2014


Cash profits were down by £1.7M on last year and were only £5.5M.  On top of this there were adverse movements in both receivables and payable, which is being blamed on an increase in business for technical consulting and the timings of collections in other areas – and after tax was paid the net cash outflow from operations was a rather disturbing £10.1M.  This was £14.5M down on the modest inflow in the first half of last year. The group also spent a small amount on acquisitions and intangible assets and did not benefit from a dividend from joint ventures (presumably due to the purchase of the remaining shares of Fred Olsen to take it in house).  Dividend payments were as good as flat so the total cash outflow in the half year was £14.5M compared to an inflow of £229K last year.  This is very disappointing and if it happens again, the group will have to think about approaching the bank for some loans (that has not happened for some time).  Although apparently the first half is usually harder on cash flow due to staff bonuses and the final dividend being paid in this period.

The oversupply of shipping tonnage continued to weigh heavily on shipbroking income and this business suffered due to the low freight rates and vessel values even though the group maintained transaction volumes.  There was some optimism towards the end of the half, however, as dry bulk rates seemed to pick up and significant newbuilding business was added.  The technical division reported a good performance and the business provided expertise to several large, long term oil and gas projects as well as fulfilling the role of technical consultant to a number of LNG interests.  The Logistics division saw a strong contribution from the ship agency and an improving logistics business and the environmental business returned to a more routine level.

Operating profit for Shipbroking in the first half was just £1.1M, down from £2.9M in the same period of last year due to the issues explained above.  The encouraging signs also mentioned above resulted in a boost to the forward order book with more than 30 newbuilding and resale contracts secured.  The tanker teams experienced low freight rates throughout the period and the Baltic dry index was on average 12% below that of the same period last year but although rates fell, volumes remained steady.  The clean product tanker market was relatively firm and the group benefited from some good volumes in the Far East and the group opened a new tanker office in Oslo.  The LNG and LPG departments won contracts which added to the forward book of business and should generate revenue for several years.

Dry bulk rates saw a marked improvement during the end of the period driven by Chinese iron ore imports, which are both increasing and also being imported from places further afield, tying up some of the bulker fleet.  The centre for the dry bulk business was moved to the Far East during the period.  The last few months have been very busy for the offshore desk which achieved a 20% increase in volumes.  The spot market remained active, supported by a decent oil price which encouraged exploration activity.  The offshore desk was also busy in the sale and purchase market, securing contracts for several newbuilding re-sales during the period.

The Technical division did well during the period and the operating profit of £3M was £1.3M higher than the first half of last year.  It is expected that this momentum will continue into the second half of the year due to the involvement in long term projects but the market is likely to soften somewhat due to seasonal variation in offshore activities in the Far East.  The improvement over last year was driven by the marine warranty surveying and engineering consultancy business in the Far East who have benefited from some large energy projects in the region and the business recently won significant new business here.  Hull and machinery damage surveying saw an increase in the number of assignments carried out with a corresponding increase in revenue and the offices in Dubai and the Far East performed particularly well.  Energy loss adjusting performed steadily with improved trading on last year and the group recently opened up a new office in Dubai.   In consultant engineering the group commenced work on a three year contract for the design and site supervision of six LNG carrier new buildings and since the end of the period the group also won additional business on the world’s largest floating LNG production project.

Logistics performed fairly well with an operating profit of £1.3M £200K higher than in the first half of last year.  The UK agency business benefited from increased port calls and a multi-year hub agency contract with an oil major which commenced in the second half of last year, although the market does remain volatile.  In Singapore the agency business was very busy.  The freight forwarding performance improved on last year with a general rise in economic activity and the board expect a similar performance in the second half of the year.  The tours business had a better cruise ship season than last year.

The profit brought in by the Environmental business fell by £1.8M to be just £200K which represents a more routine level of activity without any major ongoing project work following the conclusion of the Rena clean up project.  So far this year activities have been steady and barring any major event, profit will be broadly similar in the second half of the year.

During the six months the group acquired the remaining 20% of Fred Olsen Freight Ltd that it did not already own for a consideration of £235K.  There was also £113K of payments being made due to deferred consideration for acquisitions made in previous years.

Going forward there does seem to be a degree of optimism in some shipping markets that a cyclical recovery is underway, in particular in an increase in dry bulk chartering rates.  Therefore the board expect the shipbroking business to produce an improved performance in the second half and the other three divisions to post similar results to the first half of the year.  The expected up-turn in shipbroking will be welcome indeed as this business has really been battered over the past few years to the extent that both the consulting arm and the forwarding sector are now more important profit wise.  On the face of it, this is a disappointing set of results.  Revenues and profits were both heavily down and it is becoming apparent how important the Rena contract was.  Net assets fell and there was a cash outflow of £14.5M.  Having said that, there is a real air of optimism around ship broking at the moment and the increased investment into the Technical sector will give Braemar a sound footing when the recovery does happen.  The dividend remained unchanged and at current share prices gives a 4.7% yield for the year, which is excellent if it is maintained.  I will be holding on here to see how the group fares at the end of the year.

On 17th January, the group issued a management statement covering the period from the half year point to date.  It was announced that as expected, ship broking performance was higher than in the first half and the logistics and environmental divisions both performed to expectations.  Braemar Technical performed strongly, driven by growth of the offshore energy market in Asia.  Unfortunately this was offset by slower than expected contract awards at Braemar Casbarian in the US which is expected to result in group profits for the year being modestly below expectations.  So, a gentle profit warning then is a disappointment, I hope it doesn’t get any worse.

On 20th March, the group announced that it had disposed of Casbarian, the US based technical services subsidiary.  The business made a loss of £400K last year and the group made a loss on disposal of £900K.  It seems that they did not want to provide the resources to turn the business around, which is a bit of a shame.

Matchtech Finance Blog – Full Year 2013

Matchtech has now released their full year results for the year ending 2013.

matchtech2013income


Overall revenues were up substantially with Engineering revenues increasing by £26.7M and Professional Services revenues up £10.9M.  Costs of sales were also up but to a lesser degree so gross profit was £2.3M better than last year at £38.4M.  Admin costs also increased, driven by a one-off £425M restructuring cost, incurred during the reorganising the group into the two current segments, that meant Operating profit was £2M higher.  A small increase in both bank interest and taxation gave an annual profit of £7.5M, £1.8M higher than last year.  Clearly this is a very pleasing result.

matchtech2013assets


Total assets were up a hefty £7.1M during the year, driven predominantly by a £5.8M increase in trade receivables.  Other assets to increase were software licences, deferred tax assets, prepayments, cash and other receivables.  Liabilities were also up with a £4.2M increase in contractor wage credits, a £773K increase in tax liabilities, a £842K increase in deferred income and £348K increase in other payables.  These were mitigated by a £3.8M fall in bank loans which meant that net tangible assets were up £4.5M to £31.7M which gives a bit more of a healthy gearing ratio.

matchtech2013cash


Pleasingly, cash profits were nearly £2M up on last year at £12.1M before increases in both receivables (due to more business as the sales outstanding actually decreased to 48.9 days) and payables gave a cash generated from operations figure of £11.5M, £2.3M higher.  Slightly higher interest and a higher tax payment due to increased profit meant that net cash from operations was up by £1.9M to £8.5M.  There was some cash spent on capital expenditure, but less than last year and £105K was made from the issue of new shares.  Most of the cash was spent on dividends, however, which was £52K higher at £3.7M.  All of this left the cash inflow standing at £4M which helped to further improve the net cash position.

By segment, profit was up in both Engineering and Professional Services and the majority of profits are still made in the Engineering sector.  All of the profits were made by the UK office and the German office is still slightly loss making, although this has improved somewhat over last year.  Overall Engineering NFI was up 7% and strong demand for contract labour meant that contractors on assignment increased by 500 to 5,500.  Government spend and international growth were positive trends and give a positive outlook to engineering in general.  In Professional Services, NFI was up 12%. Fees from permanent recruitment improved by 5% with a weighted improvement in the second half of the year.  The demand for highly skilled labour continued to outstrip supply and the time to hire period remained longer than pre-recession levels.

This year, the group has simplified its structure and restructured the business into Engineering and Professional Services – this does streamline things and helps to hide the worst performing business units which is probably not just a coincidence.  As part of this, the group launched Connectus, a new brand that was formerly the Information Systems and Technology sector within Matchtech.  So far, the new brand is trading strongly and has already won some higher margin business.  The acquisition of Provanis, a niche Oracle recruitment agency will help the brand expand further and it is being integrated well.

The NFI for the engineering business has grown across most sectors with only Aerospace (down £100K to £3.2M) and Science (down £100K to £1.1M) falling.  The most important sector, infrastructure increased fees by £300K and accounted for £5.7M of fees.  Next was energy, up £200K to £4.8M; then Automotive, up £300K to £3.5M and Marine, up £300K to £3.3M.  General Engineering did very well, up £700K to £2.4M.

Although based in the UK, Matchtech has won contracts in the Middle East, China and North America.  The Infrastructure sector includes major engineering projects in water and waste infrastructure, roads, rail and property.  Matchtech is now n year 5 of the water industry’s Asset Management Plan and work on that has slowed as certain phases near completion.  Design work is due to start again next year so recruitment volumes should rise again for that.  Environment and Waste grew very well with a 56% increase in placements.  New EU legislation in this area should drive investment and increase opportunities for the group.  Investment in rail projects continued with key UK projects being complemented by overseas projects such as the Doha, Riyadh and Dubai metros.  The highways market is also buoyant with many local and central government projects taking place.  The group is currently recruiting for some very large projects including Doha airport and the Heron Plaza in London.

In the Energy sector, the group is working on some large scale UK oil and gas projects and demand is strong across both power generation and transmission.  In nuclear, there is no clear news with regards to new power stations but there are some projects involving the decommissioning of old stations and the Trident submarine programme.  There are also a number of projects involving renewable energy.  The Aerospace sector saw demand for engineers in many areas.  There were several airbus projects moving from the design phase to manufacture and despite the lack of growth this year, management are more confident about next year.  Automotive benefited from the UK car industry’s increased sales to the BRIC economies and demand for engineers was strong in key clients JLR and BWM.  There were also opportunities with Chinese OEMs during the year.  There were increased vacancies n Marine for the shipbuilding programmes taking place in Canada, Abu Dhabi, Italy, America and Romania and the group also won some contracts closer to home with opportunities in leisure and commercial recruitment, particularly in luxury yacht building.  In the Science sector, pharmaceutical and biotechnology sectors remained busy and private healthcare showed strong demand for radiographers and biomedical students.  Performance in Germany was poor and NFI was down by 11% as there was a lack of aerospace projects that relied very heavily on Airbus.  Automotive was flat over the year but energy showed some growth.

Connectus, the new brand is focused on SAP, business intelligence, project management, automation, networking, software development and cyber security.  The business has gained traction by adding 135 new clients to make the total 435.  Barclay Meade serves the procurement, HR, Sales, Marketing and Finance areas.  During the year the NFI increased by 8% and the client base grew by 100 to 400.  It was decided during the year that the business would exit from Executive Search and Financial Services to focus on the other, higher margin areas.  The exited markets accounted for 13% of Barclay Meade’s NFI.  Alderwood works within Welfare to Work and work-based learning provision.  There was strong demand and NFI increased by £100K to £1.2M.  In contrast to the other parts of the business, Alderwood generally fills permanent vacancies and the introduction of government skills funding and university tuition fees have driven considerable demand in the work-based learning market.  Although the group are strongly positioned for further growth in these areas, there is currently no desire to increase headcount.

This year it was announced that founder and long standing chairman, George Materna was stepping down in December.  As mentioned in a previous update, he will be replaced by Brian Wilkinson who arrived with a lot of international experience in the recruitment industry.  George will stay with the group and become non-executive deputy chairman, replacing Andy White who will himself remain on the board as a non-executive director.

In recruitment, the middle market has suffered in the recession and is shrinking, probably being replaced by internet job boards and candidates finding new positions through social media.  Matchtech has been mostly unaffected by this as they focus on higher margin niche engineering roles.  The group has one client that it is quite dependent on, which accounted for 13% of revenues this year, an increase from 12% last year.  The client is Xchanging, which was originally the procurement arm for their BAE contract but has now been cross-sold across most of the group’s brands.  This client does only account for 7% of NFI, however, and there are 1,600 clients in total.

After the end of the year the group purchased Application Services Ltd, trading as Provanis which is a niche technology recruitment business for a cash total of £4M paid for by a placing of just over 1M new shares.  The acquired group will fit in with group’s current rebranded technology business, Connectus.  The group are looking to invest in both IT and HR and have budgeted £1M for this next year

Overall, this is a very positive update.  Revenues were up across both business sectors, profit was up £1.8M to £7.5M, net tangible assets increased by £4.6M to £31.7M and there was a positive cash flow of £4M despite an increased £3.7M being paid out in dividends.  The group seem to be targeting IT for investment and net debt is being reduced in a steady way, down by £4M on last year – the figure in 2013 is £10.5M.  This debt is still on the high side in my view and a 1% movement in interest rates would have an effect of reducing profit by £292M.  After an amazing rally, the share price has doubled in since last year and current P/E is a fairly toppy 17.9 and next year is predicted to be 16.3. After a 15% increase in the dividend payment, the yield at the current share price is still fairly decent at 3.3% and covered two times by earnings, with the cash generative nature of the business at present I would not be surprised to see further increases at the half year stage.  Despite the recent share price hike, these still seem pretty good value to me.

On 15th November the group released a trading update.  It was stated that performance was in line with expectations with like for like NFI up 13% on the same period of last year with contract NFI up 14% and permanent fees up 11%.  It was also noted that as the UK economy recovers there are the first signs of permanent contract confidence returning.  Overall a very decent update.

On 6th February, the group released a statement covering the first six months of the year ending 2014.  It was stated that they continued to trade well and that full year results are likely to come in slightly ahead of expectations.  Net Fee Income during the first half of the year was £22M, 15% up from the same period of last year.  It also seems the integration of Provanis is progressing well and it has traded within expectations. Contract NFI was 13% up at £14.9M and despite a 300 reduction of contractors from their largest client, the number of contractors on assignment remained the same.  Permanent Fee Income increased by 19% to £6.3M.  The only slight bit of disappointment was the net debt level, which at £8.7M was below that of the end of the year but still above the position that it was at this time last year.  Overall a good update.

Tesco Finance Blog – Full Year 2013

Tesco owns a large number of retail stores across a number of different regions.  By far the most important market is the UK but the group also have operations in other, mainly Eastern, European countries (Czech Rep, Hungary, Poland, Ireland, Slovakia and Turkey).  The other main region is Asia, with stores in China, India, Malaysia, South Korea and Thailand.  In addition to grocery and general retail, the group also provide banking and insurance services through Tesco bank. Tesco has now released their full year results for 2013.

tescoincome

Overall revenues were up as a strong UK and Asian performance was somewhat counteracted by struggling European sales as continued financial issues affected the European markets where Tesco is present.  We also see that cost of sales were also up, including non-cash items such as depreciation and amortisation including impairments to PPE and provisions for onerous leases, which increased by a nearly £1B and one-off non-cash items as impairments to goodwill came to just under £500M after not occurring last year.  Most of the goodwill impairments were against the Polish assets with smaller amounts against Czech and Turkish assets following a period of difficult trading in those countries.  Most core operating costs were also up, however, with employee costs up £334M, cost of inventories up £249M and operating lease expenses up £194M.  All these increasing costs meant that gross profit was down by £1.4B on last year (although it is worth mentioning that this is roughly accounted for by the increases in depreciation, amortisation and impairments.).  Admin costs were pretty much flat year on year but the group suffered a £339M loss on property items this year compared to a £397M profit last year which was related to a £804M UK property write-down due to the end of the “space race” of large store openings.  This left the operating profit down by just over £2B.  A small increase in interest  payable and a fall in the income from associates and joint ventures was mitigated by  a small increase in net pension finance income before a smaller tax charge meant that profit for continued operations was £1.386B, £1.778B less than last year. 

When the discontinued operations in Japan and the US are taken account of, however, this profit is almost entirely wiped out (£1.215B of the loss came from the US operations) and the overall profit from the year was just £120M, £2.694B lower than in 2012.  This seems very disappointing indeed but when £916M of extra losses from discontinued operations;  £919M of extra amortisation and depreciation, and £495M of goodwill impairments are taken into account the actual profit was only £364M lower, which is still disappointing but not the disaster that it initially appears.

tescoassets

Total assets for the year fell by £652M on last year.  The bulk of the falls were in land and buildings, down£954M; short term investments, down £721M; Goodwill, down £495M due to the previously mentioned impairment; and available for sale financial assets  (relating to investments in bonds), down £449M.  These reductions were partially counteracted by some increases with by far the largest increase being loans and advances to customers, increasing by well over £1B, presumably as the bank gains traction with new credit accounts.  Unfortunately the fall in assets was compounded by an increase in liabilities with the largest increases being customer deposits, up £613M – again, due to the bank increasing customers; and pension liabilities up a disappointing half billion pounds.  There was a smaller increase in provisions which relate to property provisions for future rents payable and provisions for refunds to customers relating to miss-sold PPI.  These and some smaller increases were partially offset by just under £1B of falls in loan liabilities and £371M less in payables to associates and joint ventures. All of this means that net assets were £1.14B lower at £16.661B but due to the impairments, net tangible assets fared slightly better at £12.3B, £706M lower than last year.  This is still a disappointing fall, though.

tescocash

Cash profits when compared to last year were a very disappointing £1.133B lower at £4.248B. Small changes in the working capital for the retail side of things had little effect but a £1.22B increase in bank loans to customers was only partially mitigated by an increase in bank deposits by customers and a decrease in other receivables which meant that cash from operations was £3.873B, £1.815B lower than in 2012.  After interest and tax took their toll, the net cash from operations was £2.837B (£1.571B down).  £1.351B was made from the sale of assets but this was dwarfed by the £2.619B capital expenditure on property, plant and equipment (£755M up on last year).  Another major source of cash was the £1.427B net proceeds from sale of investments (£2.194B higher than the spend last year on investments).  This was mitigated by a net £1.202B reduction in borrowings and £1.184B spent on dividend payments.  All of these factors gave a cash inflow of £194M compared to an outflow of £141M last year.  Despite the one-off receipts from the sale of investments and assets, given the repayment of loans and hike in capital expenditure, this is actually a fairly decent cashflow.

Until late 2010 all of the Tesco bank branded insurance products were underwritten by RBS insurance and the agreement was finally settled in September 2012. 

Tesco has a number of assets held for sale and discontinued operations.  It was decided that overseas operations that had no realistic prospect of turning a profit within a certain time frame were to be sold.  As part of this programme the operations in Japan have been sold at the start of the year and the board has approved a plan to exit the operations in the US.  During the year the group also disposed of its interests in Greenenergy Ltd.  The exit of the US operations is still on-going and the full financial effect is yet to be known.  The asset write-downs and provisions for future liabilities have already affected profits by £1B. 

Overseas markets are still an important part of profit for Tesco and they still make 29% of profit from outside the UK.  The markets are split into three separate groups.  Thailand, South Korea and Malaysia are currently important markets and the group still see the potential for good future growth in these countries.  Although South Korea was impacted by the new regulations for opening hours, performance was strong and these fast growing economies are the international priority.  In the Eastern European markets Tesco has solid and in some cases, market leading positions but the economic backdrop has affected sales.  Long term the infancy of these markets offer good potential for the group but in the short term conditions are going to remain tough.  China, Turkey and India offer good long term prospects but the group is adopting a steadier pace to growth that is more cautious about capital allocation.  In India Tesco work with the Tata group as current regulations prevent them from committing their own capital.  In the other two markets, capital will be invested but at a much more refined pace. 

Profit wise, the UK is by far the most important market (£2.272B) with Asia providing the next highest amount of trading profits (£661M).  About half as important as Asia is Europe (£353M) with the bank profits still fairly modest at £191M.  Unfortunately trading profits were down across all regions with the UK falling by 8.3%.  Asian profits fell by 9.8% with the Sunday closing regulations in South Korea impacting profits there by £100M.  Going forward, the group expects the regulations to have a detrimental effect of £40M on profits.  In Thailand, sales were up 3.1% and Tesco continued to gain market share as 300 new Tesco Express stores were opened.  As mentioned elsewhere, expansion in China has been more cautious as in the market as a whole there were more stores opened than there was customer demand.  Tesco opened 12 new stores and closed 5 underperforming ones.

European trading profit was down 33.3% as the group faced continued strong macroeconomic headwinds.  Performance in Slovakia was strong, as was underlying Hungarian performance, although profits there were held back by the crisis tax.  In the Czech Rep and Poland, the group faced increased competition with retailers who had a greater proportion of smaller stores fared better.  The performance in Turkey was poor with very intense completion and a number of one-off issues giving a loss in the country which dragged the European result down.  The group is no longer looking to open any new stores in the East of the country.  These difficult market conditions led to a write-down of goodwill on assets in Poland, Czech Rep and Turkey.

The bank completed the final stage of migration this year and started focusing on marketing their products and introducing some new ones, such as mortgages and a new ISA range. During the year there was good growth in customer accounts and balances but the insurance business was held back by a challenging market with considerable downward pressure on prices.  Trading profit was down 15% due to fair value releases and the run-off of the legacy agreement with Direct Line.  Without these two issues, profits would have been up by 13% driven by strong consumer lending.  Another non-cash issue was the £115M increase in provisions for PPI miss-selling. 

During the year the group undertook a number of sale and leaseback operations.  One involved UK properties sold to the Cambridge University Endowment Fund.  In this transaction, four trading stores and three sites under development were sold for £493M.  There were also two sale and leaseback transactions in Thailand as 17 trading malls were sold to the Tesco Lotus Growth fund, an associate of the group for £360M.  The second transaction involved five further malls sold for £143M.  The board have signalled their intention to slow down the rate of sale and leasebacks in the future.  This is a decision that I agree with and have never really liked the short termism of sale and leaseback programmes.  After the current refresh of the UK stores, the group is targeting a much lower capital expenditure level to an amount that is only 3.5% of sales.  This will enable the group to wean itself off the need to sell and leaseback its stores to boost cash flow.

It is noticeable from reading the annual report that the board are trying to shift the focus for Tesco.  The future for grocery retail in the UK seems to be online and convenience stores and Tesco is already in a good position in both of these areas with a huge convenience store portfolio and a profitable online business (not actually that common for grocery retailers).  Other practical moves are to end the so called “space race” for more and more large stores.  Another focus is on UK customer experience and a more disciplined expansion in China. An example of this is the fact that Tesco invested £200M to employ 8000 more staff and to train up the rest of their staff so they can serve customers in a more appropriate way.  This already seems to be working as customer surveys indicate that service levels are improving.  There was also a refurbishment of 300 stores during the year. 

Another area that the group has made moves to improve is the customer experience in stores so that it rivals that of shopping malls.  In order to achieve this they have purchased Giraffe and invested in Harris + Hoole, a new coffee shop that may even have the potential to be a money spinner in its own right given the success of Costa for Whitbead.  Increased investment in technology is shown by the investment in blinkbox and the launch of Clubcard TV which is a free service offering films and TV series to their “most loyal” customers.  I am not sure what this means in actuality but they are also launching Blinkboxmusic and Blinkboxbooks.

The property portfolio continued to be a decent source of income and profits on property related items were £370M due to transactions that took place in the UK and South Korea.  There was continued investor interest in the property and the value of the group’s property exceeds £38B.

The main issues that affected the international business were continued economic challenges being experienced in some Eastern European markets and legislation restricting opening hours in South Korea, which is currently Tesco’s second largest market after the UK.  Revenues were mixed with increases in the UK and Asia, despite the new regulations in Korea counteracted by falls in Europe where conditions were tough, and the bank which is still being affected by some legacy items.  Profits for the group were nearly non-existent this year but the blame can put on one-off items and the performance of the US business held for sale. Underlying performance looks pretty decent outside of Eastern Europe and Poland and Turkey in particular.

Net debt is currently at £6.597B which is an improvement of £241M over last year due to reduced capital expenditure and a small increase in property proceeds.  Not including the discontinued US and Japanese operations, the P/E ratio is currently 21.1, which is certainly not cheap, although this is predicted to be just 11.9 in 2014.  At the current share price the dividend yield is 4.1% which is not bad, but only just covered by continuing operations.  There does seem to be a decent cashflow cover though.  There is no doubt that Tesco is going through a challenging transformation at the moment but I can see enough underlying performance to convince me to stick with them for the medium term.

 On 9th January Tesco released their results for the six week Christmas period.  At constant exchange rates overall group sales fell by 0.6% excluding petrol.  In the UK, sales also fell by 0.6% reflecting a weaker grocery market.  The stores that had recently been refreshed did perform better, though.  Overseas Asian sales fell by 0.6% on the same comparison due to falling sales in Thailand as they continued to experience political problems, slightly offset by a small improvement in Korean trading.  Sales in Europe fell by 0.8% but included positive like for like sales growth in Poland and Hungary.  It is worth noting that the group were hit by adverse exchange rates and due to this, actual international sales fell by 2.2%.  The board expect the full year results to be within market expectations.  Overall, this is a disappointing performance, particularly in the UK but not a total disaster.