TT Electronics Share Blog – Final Results Year Ended 2017

TT Electronics has now released their final results for the year ended 2017.
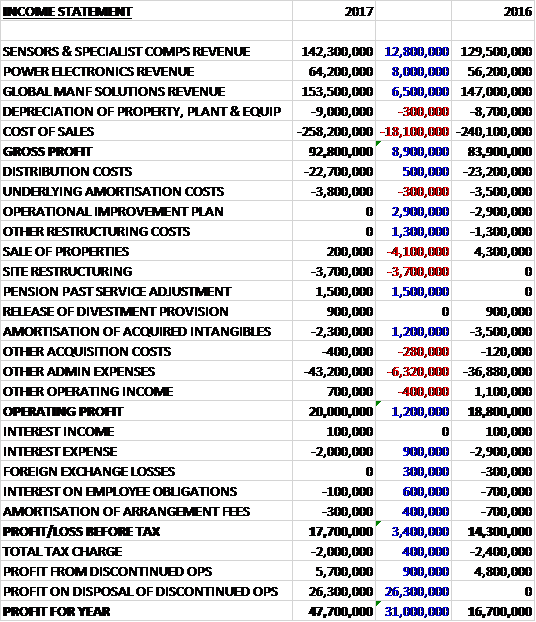
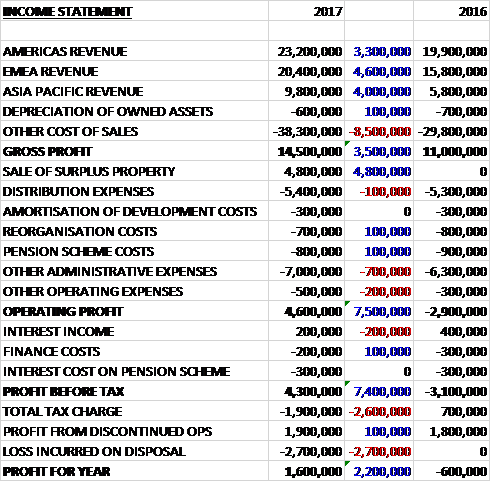
Revenues increased when compared to last year due to a £12.8M growth in sensors revenue, an £8M increase in power electronics revenue and a £6.5M growth in global manufacturing solutions revenue. Cost of sales also increased to give a gross profit £8.9M higher. Distribution costs were down £500K, the amortisation of acquired intangibles fell by £1.2M and there were no operational improvement plan costs, or other restructuring costs, which accounted for £2.9M and £1.3M respectively. There was also a £1.5M gain from pension past service adjustments but the group brought in £4.1M less from the sale of properties, and incurred £3.7M of site restructuring along with £6.3M more other admin costs, all of which gave an operating profit £1.2M higher. Interest expenses and pension interest fell during the year and the tax charge declined by £400K to give a continuing profit of £15.7M, a growth of £3.8M year on year.
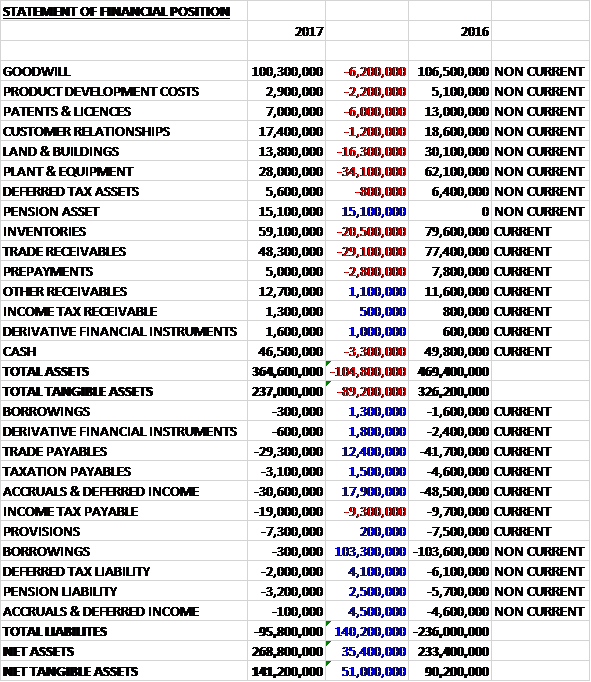
When compared to the end point of last year, total assets declined by £104.8M driven by a £34.1M fall in plant and equipment, a £29.1M decrease in trade receivables, a £20.5M fall in inventories and a £16.3M decline in land and buildings, partially offset by a £15.1M growth in the pension asset. Total liabilities also declined due to a £104.6M fall in borrowings, a £17.9M decrease in accruals and deferred income and a £12.4M decline in trade payables, partially offset by a £9.3M growth in tax payables. The end result was a net tangible asset level of £141.2M, a growth of £51M year on year.
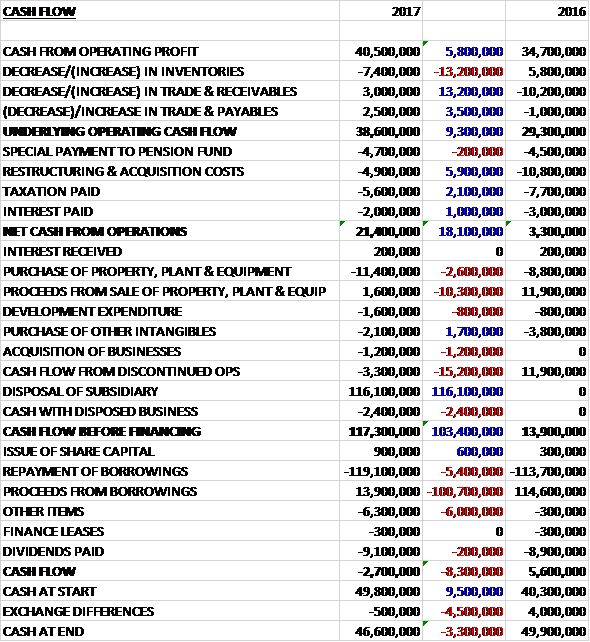
Before movements in working capital, cash profits increased by £5.8M to £40.5M. There was a cash outflow from working capital but this was less than last year. Restructuring costs were £5.9M lower, tax payments fell by £2.1M and interest payments were down £1M to give a net cash from operations of £21.4M, an increase of £18.1M year on year. The group spent £11.4M on property, plant and equipment, £1.6M on development expenditure, £2.1M on other intangibles and £1.2M on acquisitions. They also gained £110.4M from the disposal of the business so before financing there was a cash flow of £117.3M. Of this, a net £105.2M was used to repay borrowings, £9.1M went on dividends and £6.3M on “other items”. This gave a cash outflow of £2.7M for the year and a cash level of £46.6M at the year-end.

The operating profit in the Sensors and Specialist Component division was £18.8M, a growth of £3.3M year on year. This represents a 21% increase and a 15% increase at constant currency. Revenues increased by 6% at constant currency as a result of market share gains and a positive market. The profitability also increased as a result of operational leverage on the organic revenue growth and margin mix improved in the second half expected.
Management have identified three areas of their focus areas for growth and where they are concentrating their R&D spend; current sensing, circuit protection, optoelectronic assembly solutions; and automotive power inductors.

They have delivered strong growth in current sensing, circuit protection and signal conditioning product lines. This is a result of strong demand coupled with market share gains, backed by favourable lead times and increased capacity. They have increased sales to customers in industrial and consumer goods, with an existing aerospace and defence customer ramping up an existing programme.

Their optoelectronics assemblies have seen good growth, primarily driven by industrial and automotive customers in the US where market conditions have been favourable. Their magnetics business has focused on power inductors for automotive where one of their customers has won a new programme with a German OEM.

During the year they increased their spend on R&D in the division by 7%, and launched ten new products. This includes four new products launched in the current business responding to customer demand for smaller and lighter components, and extended capabilities to protect circuits from greater power surges.

The operating profit in the Power Electronics division was £6.2M, an increase of £1.2M when compared to last year. Revenues increased by 12% on an organic basis including the one-off last time buy activity, now complete, associated with moving production from Fullerton to Bedlington. The growth was a result of continued platform growth in aerospace and defence and the ramp up of product lines that were outsourced to the group from a global engine manufacture.

In the first half the group acquired Cletronics, a small US-based manufacturer of electromagnetic components for the aerospace industry for £1.2M. The acquisition helped accelerate the strategy for their power electronics capabilities in North America and adds product and technical breadth to the capabilities acquired with Aero Stanrew in 2015. The business contributed £200K of underlying operating profit in the nine months of ownership.

The group has seen good growth from their partnership with Rolls Royce to provide power and control microcircuits used in the engine control unit for the next generation of aerospace engines. They have also seen good growth from the ramp up of product lines that were outsourced to them from a global engine manufacturer. In addition they have also seen an increase in volumes associated with winning additional content on the Gulfstream business jets and the ramp up of the Airbus A350XWB.

During the year they launched six new products in partnership with their customers, underpinning their future growth. New products launched include a magnetic component for an Electronic Load Management System for aerospace and defence applications and power and control microcircuits including their application-specific integrated circuit product ranges.

The operating profit in the Global Manufacturing Solutions division was £6.5M, a growth of £200K when compared to 2016. This represents a 3% increase but a 3% decline at constant currency. Organic revenue increased by 2% with growth stronger in the second half, especially in Asia driven by customers in the medical and transportation markets. Likewise, the operating profit improved in the second half.

In the US the aerospace and defence market strengthened and the group was selected as a strategic partner and won multi-year contracts with an OEM customer. This win was complemented by four further aerospace and defence contracts won with new and existing customers. Medical markets also strengthened with macro drivers in Asia maintaining strong investment. The group won a number of new customers for PCBA, systems integration and cable assemblies in medical markets in both the US and Asia. In Asia, they also won a new contract for a rail infrastructure project.

In the second half of the year the group announced that the Romania site would close in H1 2018 as part of the separation of the transportation division. Customer qualification to move production to the UK and China is progressing as expected. Although the European operations have faced challenging conditions, they have made good progress with a transportation customer with whom they have doubled their revenues over three years.
In October the group disposed of the Transportation Sensing and Control division to AVX Corp for £125.6M in cash. In the year the business generated profit of £5.7M and the generated a profit of £26.3M on disposal.

In 2016 the triennial valuation of the UK pension scheme showed a deficit of £46M. The group agreed additional fixed contributions until 2020 which amount to £4.9M, £5.1M and £3.9M over the next three years. This year the group paid £2.4M. Both the UK and US schemes are closed to future accrual.
During the year total restructuring costs amounted to £1.6M of which £3.7M related to costs associated with site restructuring, a credit in respect of a pension past service adjustment under which members agreed to exchange future pension increases for an additional amount of initial pension and a profit arising on the sale of certain properties (£200K). In December new legislation was enacted changing the basis of US tax which resulted in a one-off benefit of £1.8M arising due to enacted changes in tax rate. During the year acquisition and disposal related costs amounted to £2.7M which related to £400K of acquisition costs and £2.3M of amortisation of acquired intangible assets.

In February 2018 the group announced the cash offer for Stadium Group for a total consideration of £45.8M plus net debt acquired of £11.8M. The business is a leading supplier for design led technologies for the industrial, aerospace and defence, medical and transportation sectors.
Going forward, the momentum in the operational performance and the improved order book (in part due to customers placing orders further ahead than at this time last year) give the board confidence that despite current forex headwinds, they will make strong progress in 2018.

At the year-end the group had a net cash position of £47M compared to £55.4M at the end of last year. At the current share price the shares are trading on a PE ratio of 25.8 which falls to 19.2 on next year’s consensus forecast. After a 4% increase in the total dividend the shares are yielding 2.4% which increases to 2.5% on next year’s forecast.

On the 10th May the group released a trading update covering the first four months of the year. Revenues was up 4% on an organic basis. Order intake has been good and the order book across all three divisions continues to be ahead of last year. The order book strength is in part due to customers continuing to place orders further ahead than at this time last year as a result of ongoing industry-wide component shortages but provides increasing confidence of delivering growth in the year.

Good growth translated into margin progression in the Sensors and Global Manufacturing solutions divisions. As a result of continued strong demand in the Power Electronics division, additional investment has been made to meet customer schedules and to build capacity to deliver anticipated future growth. These costs, together with the absence of last year’s high margin one-off sales will impact the division’s margin in the first half, which is expected to normalise for the full year.

In April the group completed the acquisition of Stadium for an enterprise value of £59.7M. In the first four months of the year, its revenue is up 5% at constant currency. The order book is ahead of the prior year, providing confidence of the business meeting the board’s trading expectations.
The group is investing £3M to create a fit for purpose facility to support strategic development and during the period they realised net proceeds of around £4M from the sale of a surplus site in the UK. Overall the board have increasing confidence of making strong progress in 2018 and they continue to review a number of acquisition opportunities.

Overall then this has been a decent year for the group. Profits have increased, net assets are up and the operating cash flow has improved with some free cash being generated. The Sensors and specialist components division and power electronics business both performed well but the GMS division struggled with a decline in constant currency profits. The performance perked up somewhat in H2, however. The New Year has started fairly well but Power Electronics division saw margins temporarily decline. The forward PE of 19.2 and yield of 2.5% looks rather expensive to me but momentum is with the shares and I will likely hold on for now.

On the 4th June the group announced the acquisition of Precision Inc for an initial consideration of $23.5M and up to an additional $4M contingent consideration. The business is headquartered in the US and is a designer and manufacturer of precision electromagnetic product solutions for critical applications. They have medical, industrial, aerospace and defence markets.

The business brings new design, simulation and manufacturing capabilities to the group in electromagnetics, one of the four focus areas for growth. Their products are primarily sold into medical applications including pacemakers, neurological implants and other in-body equipment as well as external diagnostic equipment such as dialysis machines and MRI scanners. They also serve industrial, aerospace and defence customers in applications including satellite power supplies and aerospace guidance systems.

Last year the business reported EBIT of $2.3M and gross assets of $7.8M and the acquisition is expected to be earnings enhancing immediately.

Dechra Pharmaceuticals Share Blog – Interim Results Year Ending 2018

Dechra Pharmaceuticals have now released their interim results for the year ending 2018.

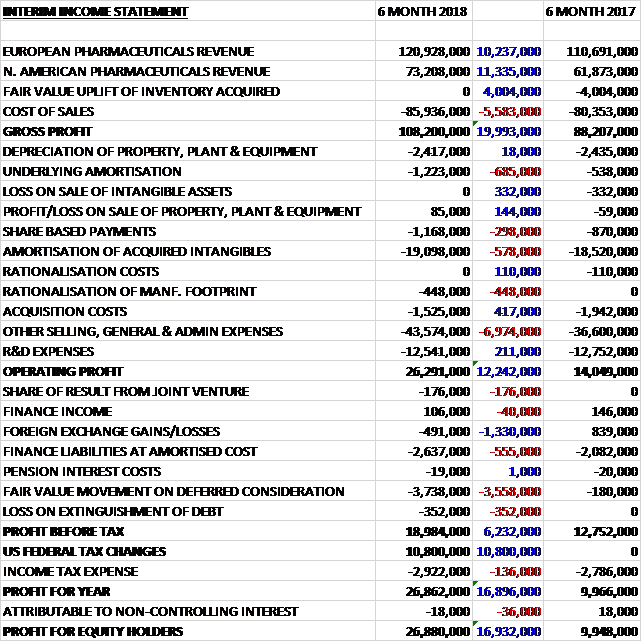
Revenues increased when compared to the first half of last year with an £11.3M growth in North American sales and a £10.2M increase in European sales. Cost of sales increased by £5.6M but there was no fair value uplift of inventories acquired which cost £4M last time. This meant that the gross profit was £20M higher. There was a £685K increase in underlying amortisation, a £578K increase in the amortisation of acquired intangibles and a £6.9M growth in other general costs to give an operating profit £12.2M higher. We then see a £1.3M detrimental movement to a forex loss and a £3.6M fair value movement on the deferred consideration to give a pre-tax profit £6.2M higher. There was a £10.8M one-off gain from the US tax changes which meant that the profit for the period was £26.9M, a growth of £16.9M year on year.

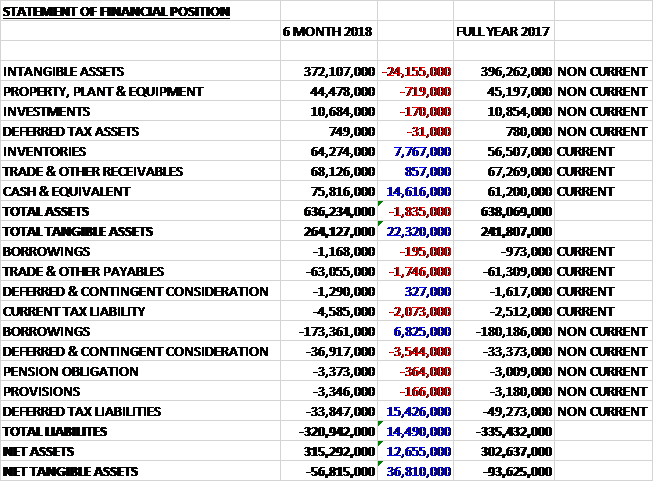
When compared to the end point of last year, total assets decreased by £1.8M, driven by a £24.2M fall in intangible assets, partially offset by a £14.6M growth in cash and a £7.8M increase in inventories. Total liabilities also declined during the period was a £3.2M growth in deferred consideration, a £2.1M increase in current tax liabilities and a £1.7M growth in payables was more than offset by a £15.4M decrease in deferred tax liabilities and a £6.6M reduction in borrowings. The end result was a net tangible asset level of -£56.8M, a growth of £36.8M over the past six months.

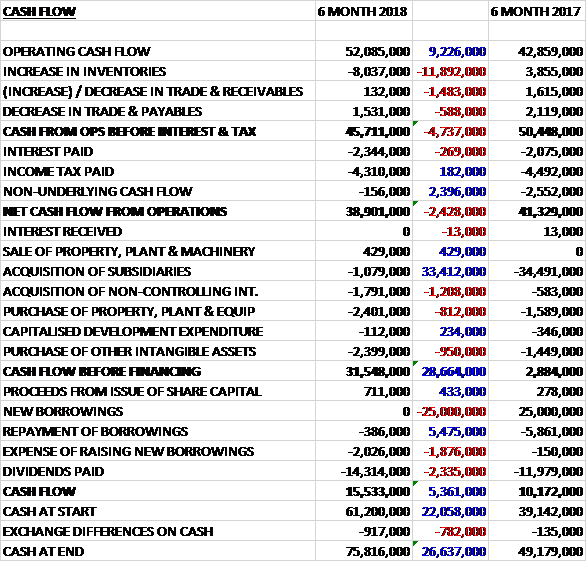
Before movements in working capital, cash profits increased by £9.2M to £52.1M. There was a cash outflow from working capital due to an increase in inventories and despite a £2.4M reduction in the non-underlying cash outflow, there was a net cash flow from operations of £38.9M, a decline of £2.4M year on year. The group spent £1.1M on acquisitions, £1.8M on non-controlling interests, £2.4M on fixed assets and £2.4M on intangible assets to give a free cash flow of £31.5M. They also spent £14.3M on dividends and £2M on raising new borrowings to give a cash flow for the period of £15.5M and a cash level of £75.8M at the period-end.

All product categories delivered growth at constant exchange rates. Companion animal revenue was up 18%, equine increased by 19%, food producing animals revenue was up 3% and nutrition also increased by 3%.

The operating profit in the European pharmaceuticals business was £34.2M, a growth of £3.4M year on year. Treating Apex on a like for like basis, at constant currency, the increase was £1M. CAP continued to be the main growth driver with sales increasing in all of the focus therapy areas. They have delivered FAP revenue growth of 3.7% in a market still experiencing pressure to reduce antibiotic usage. Nutrition is recovering with a growth of 3% following the resolution of historic supply and palatability problems, and is in the process of being relaunched with new packaging and improved palatability. Despite the increasing market penetration of Osphos, equine sales were down 4.3% due to generic competition to Equipalazone.

The operating profit in the North American pharmaceuticals business was £25.5M, an increase of £7.4M when compared to the first half of last year despite distributors selling white label goods to compete with Carprovet and the fact that trading was disrupted by two hurricanes. There was good growth from CAP and equine, with the latter mainly from Osphos. These are the only two areas the group is active in the region. Investment continues to be made in the US sales team where they have increased the reporting regions from four to six, adding two regional managers.

Several new product registrations were achieved in the period. In European FAP, registrations included Solacyl Water Soluble Powder, a line extension of an existing product for turkeys; Diatrim, an antibiotic for cattle mastitis; and Avishield IBH120, their second EU-registered poultry vaccine developed in Croatia. Numerous international registrations were also achieved, including products for New Zealand, Thailand, Kazakhstan and Australia.

In North America they have extended the range of their Vetivex critical care fluids and have launched all dosage sizes of AmoiClav tablets. In Mexico they have launched Osphos, Vetoryl, Cyclospray and several products from their dermatology range. In addition, they have acquired the following new products from licensing deals: Redonyl Ultra, a dermatology supplement from Premune; Vetradent, a water additive to combat biofilms from Kane Biotech; and Bioequine, an equine herpes vaccine from Bioveta. They also continue to work with Animal Ethics to accelerate the global registration of Tri-Solfen.

During the period there was the inclusion of an exceptional tax credit of £10.8M which arose as a consequence of the reduction in the US federal tax rate.
In December the group acquired RxVet, a sales and distribution business based in New Zealand. The total consideration was £333K and the acquisition generated goodwill of £57K. The business contributed a loss of £5K since acquisition but had it been part of the group for the whole period, it would have contributed profits of £51K. The business has been the Dechra distributor in New Zealand since 2010.

In February, after the period-end, the group acquired AST Farma and Le Vet for a total consideration of €340M funded through a placing of 5,121,952 new shares to institutional investors, the issue of 3,670,625 new shares to the vendors and a drawdown of €150M under a new banking facility. AST Farma strengthens the group’s position in the Dutch market and provides them with a direct to vet relationship with the potential to increase sales of their existing brands. Le Vet strengthens their product portfolio across Europe with 60 generic registrations that can be sold through existing networks. The initial phase of integration is progressing to plan.

Going forward, current trading continues in line with management expectations and the initial phase of integration of the AST Farma/Le Vet acquisition is progressing well. Competition from US distributors private label products has increased and they continue to experience direct competition on a number of products in the European portfolio. Despite this, the board are confident of meeting their expectations for the year.

After a 20% increase in the interim dividend, the shares are yielding 0.8% which increases to 0.9% on the full year consensus forecast. At the current share price the shares are trading on a PE ratio of 100.2 which decreases to 36.8 on the full year forecast. At the period-end the group had a net debt position 98.7M compared to £120M at the year-end.

Overall then this has been a good half year for the group. Profits increased, as did net tangible assets, although they were still negative. The operating cash flow deteriorated somewhat but this was due to working capital movements and the cash profit increased with a decent amount of free cash being generated. The North American division performed very well, but there is more competition from white label products; and the European division put in a solid performance, although equine products saw a decline due to generic competition.

The big event after the period-end was the acquisition of Le Vet and AST Farma which seems to be integrating well. All of this good performance is in the share price though and a forward PE of 36.8 and yield of 0.9% makes the shares look rather expensive. Nonetheless I continue to hold.

On the 10th July the group released a trading update covering the year as a whole which was in line with management expectations. Reported group revenue was up 14% at constant exchange rates. European pharmaceuticals was up 11% (4% on an organic basis) and North American pharmaceuticals increased by 18%. This has been driven from the core portfolio, good market penetration and recent pipeline launches. In addition the acquisition of the AST Farma, Le Vet and RxVet businesses have all grown strongly in the year since acquisition.

Character Share Blog – Interim Results Year Ending 2018

Character has now released their interim results for the year ending 2018.

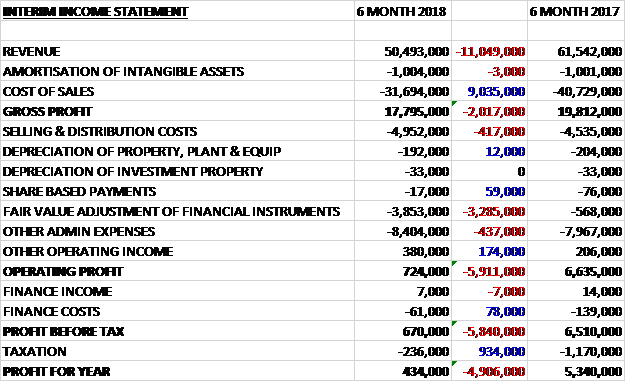
Revenues declined by £11M when compared to last year and with cost of sales down just £9M, the gross profit declined by £2M. There was a £417K growth in selling and distribution costs, a £3.3M increase in the losses from financial instruments and a £437K growth in other admin expenses which meant that the operating profit fell by £5.9M. There was a modest decrease in finance costs and a £934K decline in tax charges to give a profit for the period of £434K, a decline of £4.9M year on year.

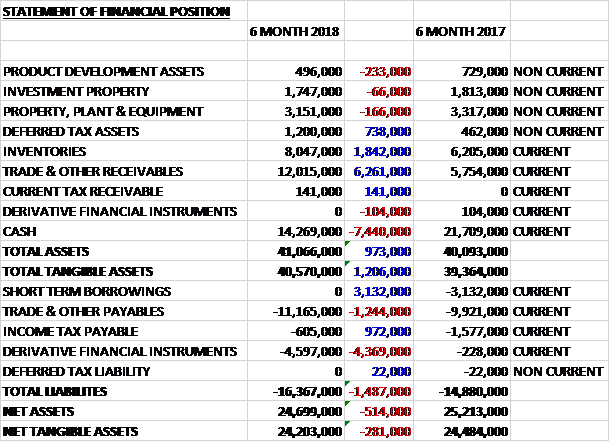
When compared to the end point of last year, total assets increased by £973K, driven by a £6.3M growth in receivables, a £1.8M increase in inventories and a £738K increase in deferred tax assets, partially offset by a £7.4M decrease in cash. Total liabilities also increased during the period as a £3.1M fall in short term borrowings and a £972K decline in income tax payable was more than offset by a £4.4M increase in derivative financial liabilities and a £1.2M increase in payables. The end result was a net tangible asset level of £24.2M, a decline of £281K over the past six months.

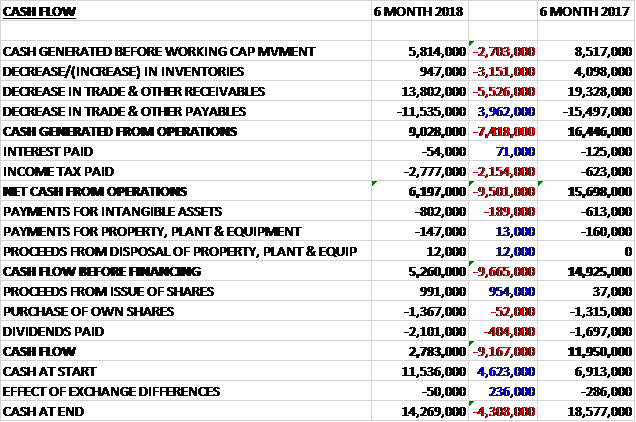
Before movements in working capital, cash profits declined by £2.7M to £5.8M. There was a cash inflow from working capital but this was less than last time and after tax payments increased by £2.2M, the net cash from operations was £6.2M, a decline of £9.5M year on year. The group then spent a net £376K purchasing shares and paid out £2.1M in dividends to give a cash flow for the half year of £2.8M and a cash level of £14.3M at the period-end.

In the first four months sales were in line with expectations, with UK sales being up and FOB sales being lower than last year. This period included the Christmas sales where the group focused on domestic sales efforts on absorbing the impact of the failure of Toys R Us in the UK. The environment for FOB sales was more challenging, and the group has been negatively impacted by several global factors, most notably the adverse forex movements and the global restructuring of Toys R Us which had a direct adverse impact on all major international markets. In January and February UK sales achieved record levels, ahead of budget.

At this year’s London Toy Fair they won two awards: The best electronic toy for the Laser X Dual Pack and the best action toy for the Original Stretch Armstrong. The leading in-house ranges of Peppa Pig, Stretch, Teletubbies and Scooby Doo, and the third party lines including Little Live Pets and Mashems, continued to trade well. They will be added to by the new line up of Pokemon toys which will be launched in the summer. Impulse buying is a growing trend and the group are looking to tap into this with their new “craze” lines such as Soft and Slo, make your own slime, cup cake cuties and Mine iT.

A significant proportion of the group’s purchases are made in US dollars. The business is therefore exposed to forex fluctuations and manages the risk through forward exchange contracts. At the end of each reporting period they make an adjustment in their statements to reflect the current valuation of these instruments. During the period this led to a charge of £3.9M. There is some volatility in this due to the timing of the exchange rates at the period-end but I would have thought in general, they would have benefited in some way given this is a hedge.

Going forward, the calendar year has started encouragingly with the established brands and new ranges selling through well at retail. The board remain of the view that the group will continue to make good progress in meeting the demands of its customers and growing the business. They are looking for a record second half year for their domestic business and a recovery in their FOB business next year.

The directors remain optimistic that the business will see a return to its previous growth pattern during the second half of the year and this will be fully reflected and significantly strengthen the trading results in 2019.

At the current share price the shares are trading on a PE ratio of 11 which increases to 12.9 on the full year consensus forecast. After a 22% increase in the interim dividend the shares are yielding 4.2% but this remains flat on the full year forecast. At the period-end the group had a net cash position of £14.3M compared to £11.5M at the year-end.

Overall then this has been a rather difficult period for the group. Profits declined, even when the forex losses were excluded, net assets fall and the operating cash flow was down, albeit still with some free cash being generated. The problems seem to be due to the collapse of Toys R US and the issues seem to have worked their way through as the last two months of the period saw a pick up in performance and the second half has started fairly well. A forward PE of 12.9 and yield of 4.2% looks OK and I am tempted to jump back in here now the issues seem to have been resolved.

Central Asia Metals Share Blog – Final Results Year Ended 2017

Central Asia Metals has now released their final results for the year ended 2017.

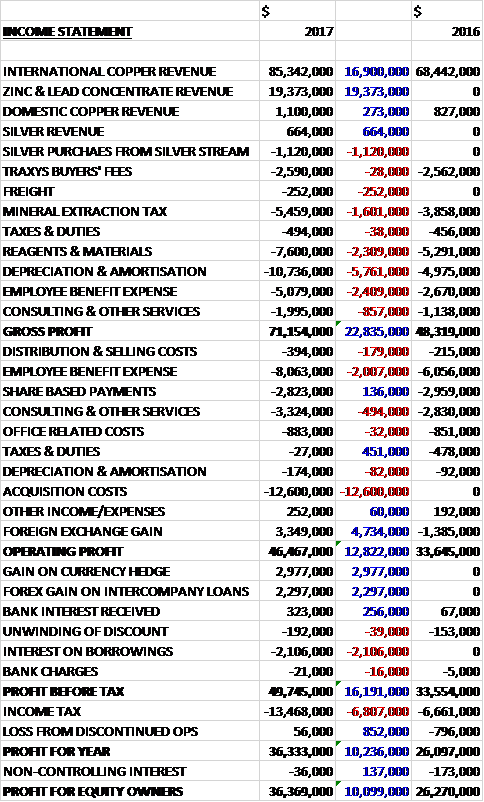
Revenues increased when compared to last year with a $16.9M growth in international copper revenue and a $273K increase in domestic copper revenue. There was also the first signs of zinc/lead revenue along with silver revenue which brought in $19.4M and $664K respectively. Mineral extraction tax was up $1.6M, reagents and materials increased by $2.3M, depreciation and amortisation grew by $5.7M, the employee benefit expense was up $2.4M and other cost of sales increased by $857K to give a gross profit £22.8M higher. We then see a further $22M increase in employee benefit expenses and $12.6M of acquisition costs, partially offset by a $4.7M positive movement in forex hedges to give an operating profit $12.8M ahead. There was a further $3M gain on the currency hedge, and a $2.3M forex gain on intercompany loans but interest costs on borrowings increased by $2.1M and tax charges were up $6.8M to give a profit for the year of $36.4M, a growth of $10.1M year on year.

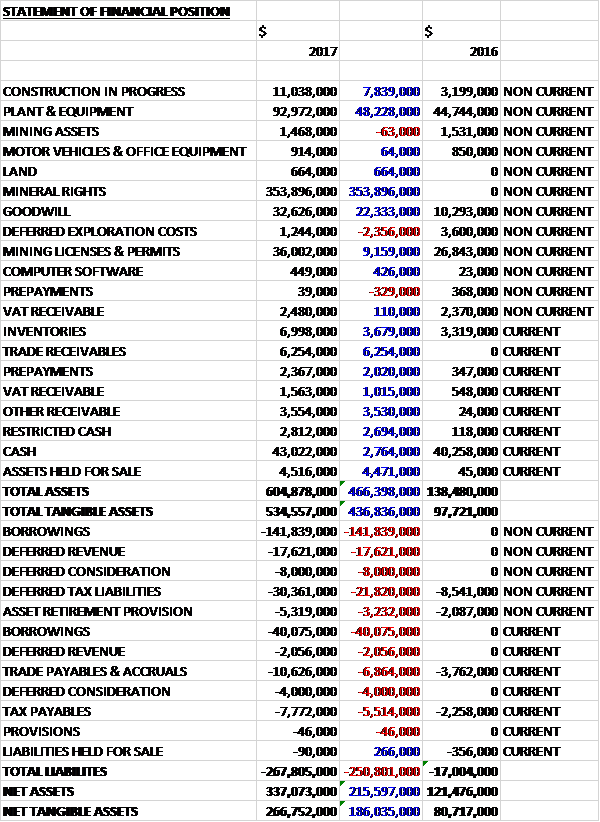
When compared to the end point of last year, total assets increased by $466.4M driven by a $354M growth in the value of mineral rights, a $22.3M increase in goodwill, a $48.2M increase in plant and equipment, and a $9.2M increase in the value of mining licenses and permits. Total liabilities also increased during the year sue to a $181.9M increase in borrowings, a $21.8M growth in deferred tax liabilities, a $17.6M increase in deferred revenue and a $12M growth in deferred consideration. The end result was a net tangible asset level of $266.8M, a growth of $186M year on year.

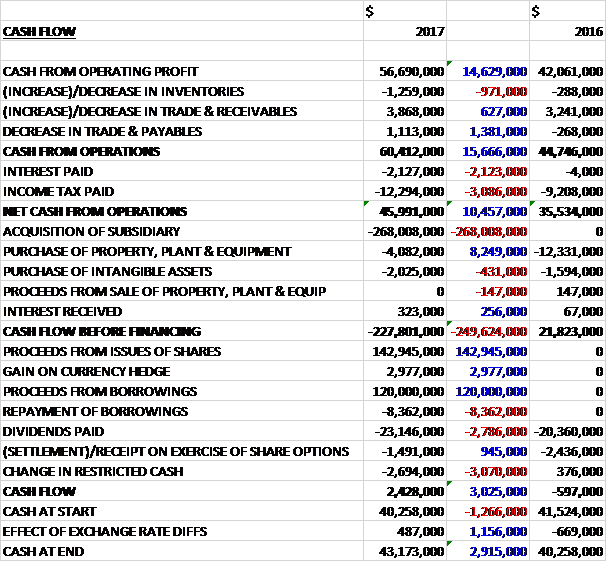
Before movements in working capital, cash profits increased by $14.6M to $56.7M. There was a cash inflow from working capital but interest payments increased by $2.1M and tax payments were up $3.1M to give a net cash from operations of $46M, a growth of $10.5M year on year. The group spent $4.1M on tangible assets and $2M on intangibles but the big spend was the $268M spent on the acquisition which meant that before financing there was a cash outflow of $227.8M. The group also paid out $23.1M in dividends but brought in $142.9M from the share issue and $120M from new loans. The end result was a cash flow of $2.4M and a cash level of $43.2M at the year-end.

These results reflect a much improved copper market, with the LME price increasing by 30% throughout the year with copper prices increasing from $4,994 per tonne last year to $6,107 per tonne. The sector is also now starting to experience cost inflation
The adjusted EBITDA for Kounrad was $63.6M, a growth of $12.2M year on year. During the year the group sold 14,001 tonnes of copper through off take agreements and 180 tonnes to local customers compared to 13,751 tonnes and 187 tonnes last year respectively.

The group produced 14,103 tonnes of copper during the year. In April they began leaching copper form the Western Dumps after their stage 2 expansion that was delivered 30% below budget as a result of the weaker local currency and engineering efficiencies. During the year 40% of the copper production was from the Western Dumps with the contribution increasing as the year progressed. Production from the Western Dumps has been in line with expectations with some 65% coming from there in Q4.

The cash cost of production increased modestly from 43c per pound to 52c per pound reflecting the increased electricity consumption and additional labour costs of working on the Western Dumps, but they remain one of the lowest cost copper producers in the world.

The maiden adjusted EBITDA for Sasa for the first two months of ownership was $14.5M. During the year the group sold its zinc and lead concentrate to two European smelters. They sold 2,906 tonnes of zinc concentrate and 4,559 tonnes of lead concentrate. In January 2018 the group entered into a zinc and lead concentrate off take agreement with Traxys which has been fixed through to the end of 2022. This is for all of the Sasa concentrate production.
In September 2016, Lynx Group entered into a Silver Purchase agreement with Lynx Metals by netting of its existing loan payable with Lynx Metals. The prepayments for the purchase of silver are recognised as deferred revenue and are related to production of silver during the life of the mine. Deferred revenue is recognised on the income statement as the silver is delivered

The EBITDA loss from Shuak was $130K. During the year the team undertook over 22,000 metres of drilling in the license area. The findings have been encouraging with additional oxide potential identified at the Kyzyl-Sor prospect and some interesting deeper intersections of Sulphide mineralisation. They will soon embark on another exploration season in 2018 which should enable them to better understand the potential in terms of continuity and likely scale.

After announcing the positive results from the Copper Bay definitive feasibility study in January the group undertook some additional engineering studies with the intention of improving the economics of the project. Some capex savings were identified and there is the potential to optimise the project further in the future. In the context of the new Sasa mine, however, the board decided that it was no longer a material asset so they have started a sales process.

In November the group acquired Lynx Resources which owns the SASA mine located in Macedonia. The mine comprises an operating underground zinc and lead mine and a processing facility that produces both zinc and lead concentrate. The group paid a total of $401.1M with $340M in cash, $49M in new shares and $12M in deferred consideration and the acquisition generated goodwill of $22M.

In June, director Kenges Rakishev sold his 86% interest in KKB bank, which the group uses for its normal day to day banking. In September he sold half of his shareholding in Central Asia Metals and in February 2018 he sold his remaining shareholding. I hope that this is not something to be worried about as having such an influential local businessman as a key shareholder was a big plus for the group in my opinion.
As of the year-end a total of $2.7M of VAT receivable was still owed to the group by the Kazakhstan authorities. A portion of this amount totalling $233K was refunded in January.

Going forward, many industry commentators are expecting a challenging year for copper supply that could result in another positive year for the copper price. In the zinc market, supply side challenges remain whilst demand is expected to increase to over 15 million tonnes by 2019. The board expect steady production from both Sasa and Kounrad. They have set their 2018 cooper production target at between 13,000 and 14,000 tonnes. They expect to produce between 21,000 and 23,000 tonnes of zinc and between 28,000 and 30,000 tonnes of lead.

At Kounrad, the proportion of copper production from the Western Dumps will increase to around 65% in 2018, and by 2020 almost all of the production will be from those areas which will mean an increase in electricity consumption. At Sasa the operational focus will be on completing construction of the new tailings storage facilities that will ensure sufficient storage for operations until at least 2026. Both mines are expected to be highly cash generative and should enable the group to return to shareholders a target range of between 30% and 50% of free cash flow.

At the current share price the shares are trading on a PE ratio of 13.6 which falls to 7.8 on next year’s consensus forecast. After the final dividend was kept the same, the shares are yielding 5.8% which falls to 5.6% on next year’s forecast. At the year-end the group had a net debt position of $138.9M compared to a net cash position of $40.3M at the end of the prior year.

On the 12th April the group released a Q1 operations update with both operations on track to achieve 2018 production targets. At Kounrad the group produced 3,070 tonnes of copper, a reduction of 287 tonnes year on year. The winter period was the coldest experienced in five years and 75% of production came from the Western Dumps. Copper sales during the period were 2,527 tonnes.

At Sasa the group produced 5,518 tonnes of zinc, an increase of 229 tonnes; and 7,020 tonnes of lead, a decline of 266 tonnes. During the period, mined and processed ore was 192,372 tonnes and 196,364 tonnes respectively. The average head grades for the period were 3.32% zinc and 3.83% lead.
Following completion of the Shuak 2017 exploration programme, the group has now received all assay results for the drilling undertaken. The new areas of oxide mineralisation that have been identified at the Kyzyl-Sor prospect have an estimated average thickness of 46 metres at an estimated average copper grade of 0.32% based on CHT drilling.

Overall then this has been another year of progress for the group with profits, net assets and operating cash flow all increasing. This mainly seems to be down to the 30% increase in copper price with production increasing only slightly and cash costs increasing due to higher electricity consumption at the Western Dumps.

The group has used this increase in commodity prices to acquire the Sasa mine which adds two more metals to their repertoire. Q1 has started OK but there was lower copper production due to the cold winter. Overall though, despite their being rather more risk here now due to the borrowings that have been taken out, I feel the forward PE of 7.8 and yield of 5.6% represents decent value and I remain a holder.

On the 10th July the group released a trading update covering the first half of the year. Q2 copper output of 3,677 tonnes brings output for the first half of the year to 6,747 tonnes, a decline of 280 tonnes year on year, attributed to a particularly cold Q1.

At Sasa, 11,020 tonnes of zinc was produced, an increase of 281 tonnes mainly due to increased grades. The mine produced 14,386 tonnes of lead, a decline of 493 tonnes due to lower grades and slightly lower recovery. Q2 zinc recoveries were lower than previous periods due to a mechanical failure of the original zinc regrind mill and commissioning of the new SMD mill. During the period they sold 180,233 ounces of silver which had been pre-sold.

Exploration started at Shauk in May and since then, 11,550 metres of core drilling has been undertaken. A survey will be undertaken in the second half as well as a diamond drilling programme to start in Q3. As of the end of the half, the group had $40.5M of cash in the bank.

Finsbury Food Share Blog – Interim Results Year Ending 2018

Finsbury Food has now released their interim results for the year ending 2018.

Revenues grew when compared to the first half of last year as a £371K decline in overseas revenue was more than offset by a £1.5M growth in UK revenue. Cost of sales grew more quickly, however to give a gross profit £723K below last time. Depreciation was up £331K but other admin costs declined by £1.4M so the underlying operating profit grew by £388K. There were £9.7M of restructuring costs, however, so the group saw a £9.2M swing to an operating loss. There was a £450K reduction in the value of hedging income but other finance costs saw modest falls so after tax charges decreased by £1.8M top give a loss for the year of £1.8M, a detrimental movement of £8M year on year.

When compared to the end point of last year, total assets increased by £3.7M, driven by a £1.7M growth in intangible assets, a £1.1M increase in deferred tax assets, a £1.1M growth in cash and an £814K increase in receivables, partially offset by a £1.4M decline in property, plant and equipment. Total liabilities also increased during the period, mainly due to a £6.6M increase in provisions and a £1.4M growth in payables. The end result was a net tangible asset level of £19.3M, a decline of £5.4M over the past six months.

Before movements in working capital, cash profits increased by £720K to £12.7M. There was a neutral working capital position compared to a cash outflow last time and after tax payments increased by £453K the net cash from operations was £10.6M, a growth of £4.2M year on year. The group spent £4.9M on property, plant and equipment, partly relating to the new cake line and business IT system, and £2.4M on the closure of operations to give a free cash flow of £3.3M. This covered the dividends of £2.6M and after a net drawdown of loans there was a cash flow of £1M and a cash level of £4.1M at the period-end.

The adjusted operating profit in the UK bakery was £7.3M, a decline of £52K year on year. The grocery ambient cake market saw a year on year volume decline of 2% but value growth of 1.3%, and the bread and morning goods grocery market saw a volume decline of 1.3% and value growth of 2.2%. The profit margin of the UK operation decreased to 5.2% due to commodity price pressures, particularly a spike in butter prices.

The adjusted operating profit in the overseas business was £1.2M, a growth of £234K when compared to the first half of last year. The business is heavily exposed to the Euro which has had a favourable impact on profits in the period. In Euro terms the business has performed well too, however.

A decision was made in August to close the Grain D’Or bakery based in London. The group had implemented a range of initiatives to improve the business but it continued to incur operating losses. It traded in a particularly competitive environment which created strong competition on contracts. Together with cost pressures being experienced across the industry the business lost two large contracts after the year-end. Formal consultations to close the bakery were concluded and closure was completed in December.

The group also closed its much smaller Campbells bakery in Scotland in October. A rationalisation programme had decreased the volumes considerably at the bakery and the overhead cost of running a small remote bakery was not sustainable. The turnover of these operations was £13M in the first half and there was £9.7M of costs relating to the reorganisation which resulted in a net cash outflow of £2.4M. The negotiations relating to the cost of exiting the Grain D’Or bakery, although last year an impairment of £4M was taken against its assets.

Going forward, the UK grocery market continues to be challenging with food inflation becoming entrenched. This is a result of increased commodity prices, the adverse impact of forex movements and the above inflation increase in the National Living Wage. The group is working hard to mitigate this input cost inflation through operational efficiency, investment in automation and price increases. The board expect the group’s steady performance to continue into the second half of the year.

Going forward, headwinds will persist into the next period but the board believe they will make steady progress in the period ahead.
At the current share price the shares are trading on an underlying PE of 13.7 which falls to 13.2 on the full year consensus forecast. At the period-end the group had a net debt position of £16.6M compared to £17.4M at the end of last year. After a 10% increase in the interim dividend the shares are yielding 2.4% which increases to 2.6% on the full year forecast.

Overall then this has been a fairly solid period for the group. Underlying profits did increase slightly, as did the operating cash flow, with an OK amount of free cash being generated, but net assets saw a decline due to the various impairments. The UK market is somewhat subdued and suffering from cost inflation, but the group broadly held their own, while the overseas market is benefiting from favourable forex movements. With a forward PE of 13.2 and yield of 2.6% these shares are not overly cheap given the current headwinds although I do believe that this company will do well when the market picks up.

On the 16th July the group released a trading update covering the year. Total group revenues grew by 2.4% on a like for like basis and the board are confident on delivering profits in line with market expectations. The core UK bakery division grew 2.8% on a like for like basis, ahead of the wider market, while the overseas division declined by 0.7%. The group has recovered the cost pressures from commodity and labour inflation through operational efficiency and price rises.
Looking ahead, the current UK economic environment remains challenging and is showing little sign of abating. Nonetheless the board believes the group will maintain its market leading production and continue to deliver growth over the period ahead.

Gem Diamonds Share Blog – Final Results Year Ended 2017

Gem Diamonds have now released their final results for the year ended 2017.

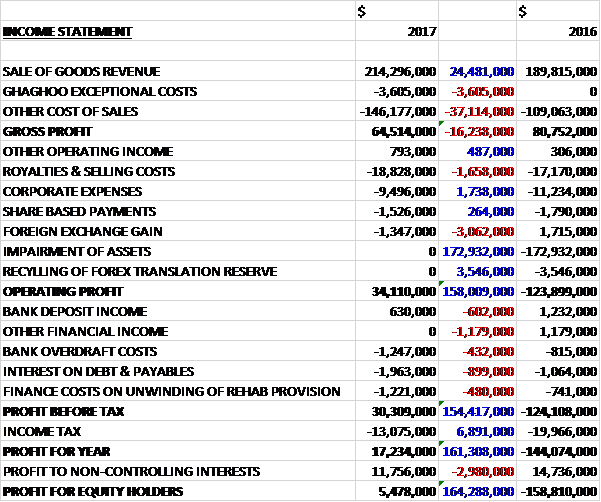
Revenues increased by $24.5M when compared to last year but underling cost of sales grew by $37.1M, mainly due to the strengthening local currency, increased waste amortisation and the fact that costs at Ghaghoo are now being expensed rather than capitalised, and there were $3.6M of exceptional Ghaghoo costs which meant that the gross profit was $16.2M lower. Royalty and selling costs increased by $1.7M and there was a $3.1M swing to a forex loss but corporate expenses were down $1.7M, there was no impairment, which accounted for $172.9M last year and no recycling of the forex translation reserve, which cost $3.5M in 2016. This meant that there was a positive swing of $158M to an operating profit. There was a $602K reduction in bank deposit income, a $1.2M fall in other financial income, a $432K increase in bank overdraft costs, an $899K increase in debt payables and a $480K growth in the finance costs on the unwinding of the rehab provision. Tax charges reduced by $6.9M which meant that the profit for the year was $5.5M, a positive movement of $164.3M year on year.

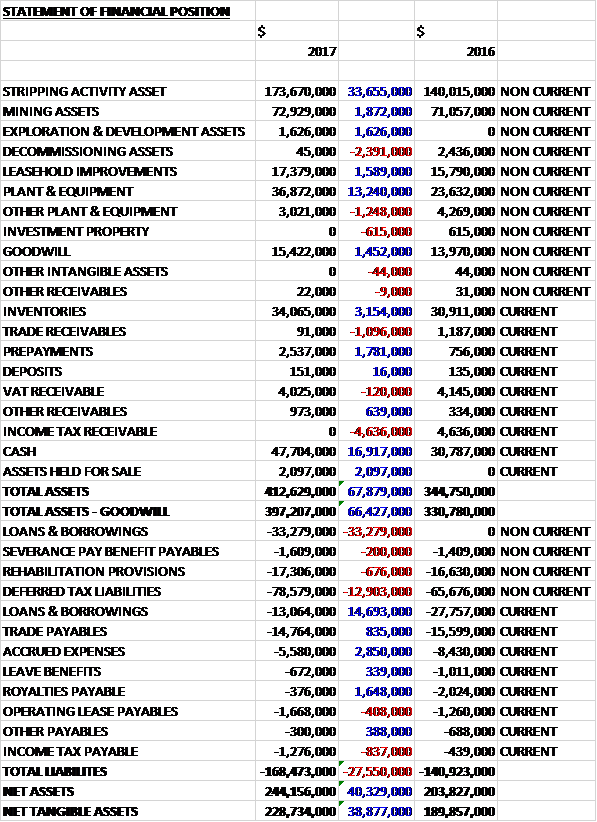
When compared to the end point of last year, total assets increased by $67.9M, driven by a $33.7M growth in the stripping activity asset, a $16.9M increase in cash, a $13.2M growth in plant and equipment, and a $3.2M increase in inventories, partially offset by a $4.6M decline in income taxes receivable. Total liabilities also increased during the year due to an $18.6M increase in borrowings and a $12.9M growth in deferred tax liabilities. The end result was a net tangible asset level of $228.7M, a growth of $38.9M year on year.

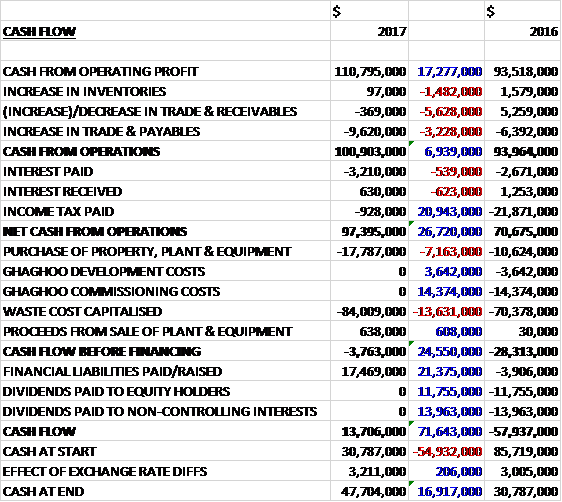
Before movements in working capital, cash profits increased by $17.3M to $110.8M. There was a cash outflow from working capital, mainly due to a decrease in payables, so the cash from operations increased by $6.9M to $100.9M. Interest payments increased somewhat but there was a $20.9M fall in tax payments so the net cash from operations came in at $97.4M, a growth of $26.7M year on year. The group spent $17.8M on property, plant and equipment, along with $84M of waste costs, to give a cash outflow of $3.8M before financing. The group took out $17.5M of new loans to give a cash flow for the year of $13.7M and a cash level of $47.7M at the year-end.

Overall the average value of $1,930 per carat achieved showed a decent increase over last year’s $1,695 per carat. Operating costs per tonne treated were 23% higher. The increase was driven by higher waste amortisation costs as a result of the different waste to ore strip ratios for the Satellite pipe ore. The increase in local currency waste costs per tonne mined of 8% was impacted by local currency inflation and longer haul distances to mine the waste cuts in line with the updated mine plan.

The second half of the year saw the group begin to benefit from the operational improvements implemented during the year with a significant improvement in the recovery of large diamonds from Letseng. The market for the mine’s large diamonds remained strong in the year, which continued into 2018. The focus on enhancing the efficiency of their operations identified a potential of $20M of annualised and one-off cost reductions at the end of last year. A target has now been set of obtaining $100M of cash savings by the end of 2021 with an ongoing target of $30M per year thereafter.

As part of the annual planning cycle, Letseng implemented an updated life of mine plan designed to reduce waste mined over the life of the open pit which resulted in a reduction of waste mined of 5MT and improved cash flows by $9M in the year. The year saw an increase in the amount of Satellite material mined in line with the updated plan. The mine treated 3% less tonnes during the year and the recovered grade of 1.69 was 3.4% higher than last year due to the greater percentage of Satellite pipe ore processed. Carats recovered were broadly flat at 108,513.

Both Letseng plants experienced a reduction in engineering availability in the first half of the year, negatively impacting ore tonnes treated. These were caused mainly by the increased downtime due to unplanned maintenance and maintenance overruns. A review pointed to deficiencies in the system and execution methodology that contributed to the lack of plant and system performance. The maintenance management system and processes have been improved and the availability of the plants improved over the course of the second half of the year. In addition, plant 2’s scrubber shell cracked in H2, necessitating a reduction in the feed rate and the design of a bypass system, which was installed in January and the installation of a new scrubber should take place in Q2.

A mobile XRT sorting machine was installed on a test basis in the second half of the year to re-treat previously generated recovery tailings. During the year, 3,298 carats were recovered from re-treating 25,404 tonnes of these recovery tailings. Based on the results, focus on operating the machine on a 24-7 basis has informed one of the initiatives which will contribute to additional throughput. The re-treatment of the recovery tailings will be concluded in 2018 and the machine will then be used to re-treat tailings generated from the Alluvial Ventures operation.

Letseng recovered seven 100+ carat diamonds during the year, two more than the prior year. The largest was a 202 carat Type IIa diamond recovered in November. There was also a 22% increase in the number of diamonds recovered between 30 and 60 carats but a slight reduction in 60-100 carat diamonds.
The construction of the relocating mining complex, which is required to make way for the expansion of the open pits, was 86% complete by the year-end and is expected to be completed in H1 2018 on time and within budget.

At Ghaghoo, during the year and earthquake occurred 25km from the mine. There was superficial damage to the surface infrastructure and the seal of the underground water fissure was damaged which led to a large influx of water into the underground workings of the mine. Water levels are being effectively managed with continuous pumping. In total $3.6M relating to the one-off costs of placing the mine on care and maintenance and the costs associated with the increased dewatering activities have been reported as exceptional.

The 13,021 carats on hand were sold during Q3, achieving an average price of $175 per carat and discussions are continuing with interested parties to dispose of the mine.

During the year progress was made on two key technologies which are in the process of being evaluated. The first of these is designed to identify locked diamonds within Kimberlite using PET technology. Due diligence work completed in the year has yielded positive results. The second is designed to liberate diamonds outside of the traditional processing technology using a non-mechanical crushing system, which utilises electrical power to fracture the kimberlite without causing damage to the diamond. The workstream is progressing well and during the year a prototype was tested in South Africa with further testing being conducted at high altitude at Letseng.

As part of the business transformation, the investment property in Dubai has been identified as a non-core asset to be sold and it is likely that this will happen within the year and is being held at a value of $615K. The directors also resolved to dispose of the aircraft which serviced the Ghaghoo mine. An offer was received from an interested party in September and a formal agreement was entered into in December. The sale was finalised after the year-end with the proceeds being $1.7M with a cost of sale of $400K.

The improved trend of recoveries of large diamonds continued into 2018 with seven 100+ carat diamonds being discovered including the 910 carat Lesotho Legend which sold for a spectacular price of $40M.

Going forward, the reduction in operating costs and improved recovery of large diamonds together with the impact of the business transformation programme offer the prospect of improved cash flows and give cause for optimism. Demand for large diamonds remains firm and the board are confident that the market for these diamonds will remain resilient for the foreseeable future.

At the current share price the shares are trading on a PE ratio of 35.6 but this falls to 5.8 on next year’s consensus forecast before rising to 14 in 2019. There are no dividends on offer here. At the year-end the group had a net cash position of $1.4M compared to a net debt position of $14.2M at the end of last year.

On the 19th April it was announced that the Lesotho PM announced their intention to renew the Letseng mining licence until 2034 (it had been due to run out in 2024).

On the 26th April the group released a trading update covering Q1 2018. During the period seven diamonds greater than 100 carats were recovered, including a 910 carat D colour Type IIa diamond which was sold in March for $40M ($43,912 per carat). In all, 32,412 carats were sold which achieved an average price of $3,276 compared to $2,217 per carat last quarter. There was an 8% increase in carats recovered.

A new scrubber shell is currently being installed in Plant 2. During this planned shutdown, additional maintenance will be done to the plant in an effort to further improve its availability. This shutdown is not expected to have a material impact on production. The mining services complex project was completed on time and under budget in April.

The business transformation four year target of $100M remains on track. Initiatives which have been implemented to date will contribute around $27M to the four year target and comprise $23M of cumulative recurring benefit and $4M of one-off savings. Of this, $15M will be from increased revenue generated from additional carats recovered from re-treated tailings through the mobile XRT sorting machine and the extension of the third plant operator’s tenure to mid-2020. A cost reduction of $8M Is mainly due to a reduction in blasting consumables through changing blasting patterns, explosive mix and charging practices. Cost reductions have also been achieved through reducing corporate office footprints and travel costs. One-off savings mainly comprise the sale of non-core assets.

At the period-end the group had a net cash position of $28.9M compared to $1.4M at the year-end.

Overall then the group seems to have turned a corner this year. Profits are down, excluding last year’s impairments, due to increased costs from stronger local currencies and increased waste amortisation, but net assets and the operating cash flow improved, although the group is not producing any free cash. The average price per carat is improving due to the higher number of large diamonds being recovered, including a truly huge one in Q1 2018. It seems unlikely that this will be repeated but it does seem that the initiatives the group is undertaking is improving recovery.

They are also bringing down costs and if the disastrous Ghaghoo mine can be sold, that would also help. This does mean that the group will become a one-asset entity which has its own inherent risks but I feel that now might be the time to take a little punt here.

On the 22nd May the group announced the recovery of a 115 carat, top white colour Type iia diamond. This is the ninth diamond of over 100 carats recovered in 2018, already exceeding the total recovered last year.

On the 3rd August the group released a trading update covering the first half of the year. During the period the Lesotho Legegend was sold for $40M which was the largest diamond found at the mine. In all they recovered ten diamonds greater than 100 carats in the period and sold 61,696 carats at an average price of $2,742 per carat, up from $2,061 per carat in the first half of last year. This led to record tender revenues of $169.2M. In July they recovered one more diamond over 100 carats.

The amount of ore treated declined by 8% but due to a 10% increase in the average grade recovered, the number of carats recovered remained broadly flat at 61,596.

A new scrubber shell was installed in plant 2 in Q2. The feed rate into the plant has reverted to normal levels since the shutdown was completed. The installation took longer than planned due to the concrete foundation of the scrubber requiring to be fully rehabilitated. As a consequence, the shutdown was extended by ten days which is the primary reason for the reduced tonnage treated.

At Ghaghoo the water fissure was sealed.

James Halstead Share Blog – Interim Results Year Ending 2018

James Halstead have now released their interim results for the year ending 2018.

Revenues increased by £6.5M when compared to the first half of last year and after cost of sales grew by £6.1M the operating profit was £382K higher. Finance costs were down £82K and tax charges fell by £241K to give a profit for the period of £18.4M, a growth of £705K year on year.

When compared to the end point of last year, total assets decreased by £9.1M driven by a £5M decline in cash, a £4.5M fall in receivables and a £757K decrease in deferred tax assets, partially offset by an £895K growth in inventories. Total liabilities also decreased during the period as a £915K growth in current tax liabilities was more than offset by a £7.9M fall I payables and a £4.7M decrease in pension obligations. The end result was a net tangible asset level of £113.4M, a growth of £2.6M over the past six months.

The operating cash flow declined by £11M to £20.2M and after tax payments fell by £211K the net cash from operations was £15.9M, a decline of £10.8M year on year. The group spent £2M on capex which meant that the free cash flow was £14M. This didn’t quite cover the dividends, of which £19.2M was paid out which gave a cash outflow of £5M for the period and a cash level of £47.5M at the period-end.

UK turnover was 2.6% ahead of last year despite the difficulties in the facilities management sector, including the demise of Carillion. Object Flor reported a 2% growth in local currency with a 4.4% sterling growth in Germany and a 14% increase in France.

Raw material costs were nearly 14% ahead of last year. The group has started using bulk storage for raw materials in Teesside to more easily source them from Asia. This has mitigated European shortages and led to lower raw material prices than those available from local sources. Up to half of their polymer requirements are sourced this way and are a hedge against pricing/exchange rate issues in Europe. In addition they can offset customs import duty as around 25% of their exports are to outside the EU.

Sales in Australia have grown 7%. Having moved their Queensland warehouse to larger premises, opened their first warehouse in South Australia and augmented their sales force with reps in North Queensland and Tasmania, the business continues to drive bottom line growth.

There has been a continued investment in sales reps in Canada which is bearing fruit with a 25% increase in turnover in the period. Falck Design, based in Sweden, posted 9% growth. Polyflor India has slipped back, however, with a decline in sales that resulted from the introduction of a general sales tax in July which disrupted construction activity and purchasing particularly in the core healthcare sector. Current trading is now back to prior year levels and growing, however. Sales in the Middle East have more than doubled with numerous healthcare and education sector projects completing together with projects in Qatar such as the Al Bayt and Khalifa Stadiums.

The three months leading up to the period-end saw the group preparing for range updates and new product launches at the major European exhibitions and there was a strong reception for these which should underpin the second half of the year. As a consequence of a German competitor entering administration the group have received multiple enquiries from customers of that business and to date have converted many of these into sales. Since the period-end, January trading was particularly strong and February and March were both ahead of last year so that sales in Q3 are ahead by around 10%.

At the current share price the shares are trading on a PE ratio of 23.7 which falls to 22.8 on the full year consensus forecast. After a 2.7% increase in the interim dividend the shares are yielding 3.1% which increases to 3.4% on the full year forecast. At the period-end the group had a net cash position of £47.5M.

On the 5th April the group announced that they were at the very early stages of evaluating making an offer for Airea.

Overall then this has been a decent period for the group with both profits and net assets increasing. There was quite a hefty decline in operating cash flow, however, and the free cash didn’t quite cover the dividends. During the period, raw material costs were an issue but Q3 has started strongly due to a competitor going out of business. With a forward PE of 23.8 and yield of 3.1% these shares are not cheap, but then again they never are and prospects look good for the second half. I am tempted.

Easyjet Share Blog – Final Results Year Ended 2017

Easyjet has now released their final results for the year ended 2017.

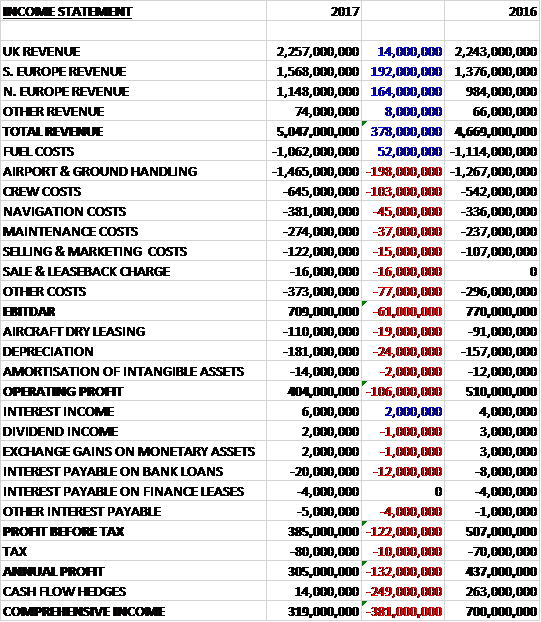
Revenues increased by £378M when compared to last year due to a £192M growth in Southern European revenue and a £164M increase in Northern European revenue. Fuel costs declined by £52M but airport and ground handling was up £198M, crew costs increased by £103M, navigation costs were up £45M, maintenance costs grew by £37M, selling and marketing costs increased by £15M, there were sale and leaseback charges of £16M and other costs increased by £77M to give an EBITDA £61M lower than 2016. Aircraft dry leasing was up £19M, depreciation increased by £24M and amortisation grew by £2M which meant that the operating profit was £106M lower. We also see an increase in bank interest and tax charges up £10M to give a profit for the year of £305M, a decline of £132M year on year.

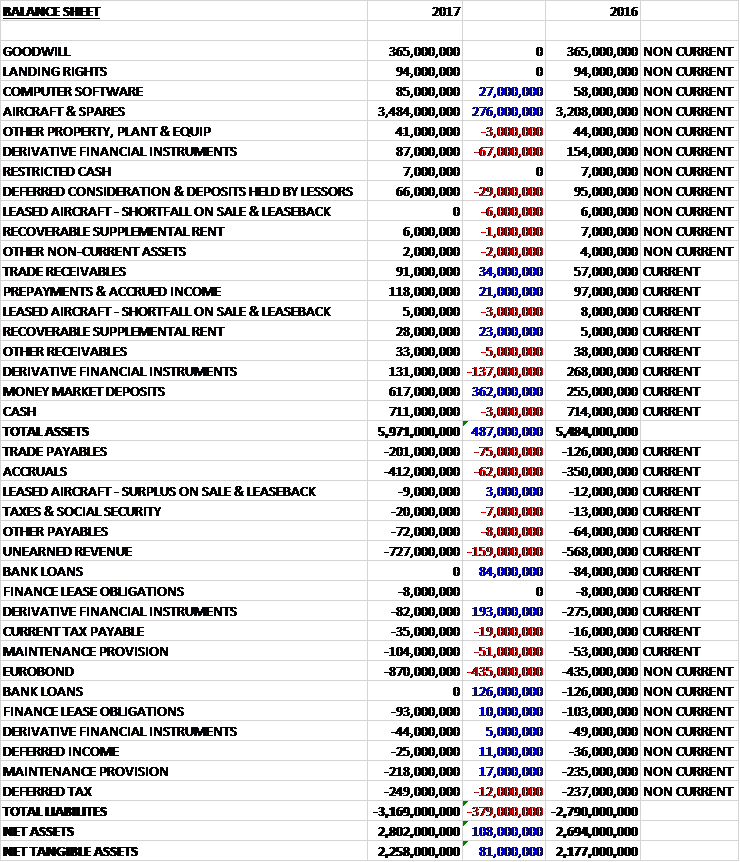
When compared to the end point of last year, total assets increased by £287M, driven by a £362M increase in money market deposits, a £276M growth in aircraft and spares and a £34M increase in trade receivables, partially offset by a £204M decline in derivative financial instruments. Total liabilities also grew during the year as a £198M reduction in derivative financial liabilities, and a £210M fall in bank loans was more than offset by a £435M increase in Eurobonds, a £159M growth in unearned revenue and a £75M increase in trade payables. The end result was a net tangible asset level of £2.258BN, a growth of £81M year on year.

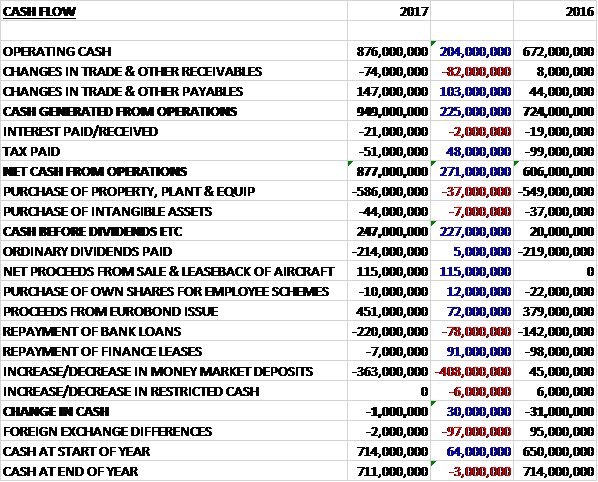
Before movements in working capital, cash profits increased by £204M to £876M. There was a cash inflow from working capital and tax payments declined by £48M to give a net cash from operations of £877M, a growth of £271M year on year. Of this, £586M was spent on property, plant and equipment and £44M on intangible assets so the free cash flow was £247M. The group spent £214M on dividends and shifted some money around with the £451M proceeds of the Eurobond issue and £115M from the sale and leaseback of aircraft used to pay back £363M of money market deposits and £220M of bank loans which gave a cash outflow of £1M for the year. The cash level at the end of the year stood at £711M.

Overall pre-tax profit declined by £86M due to unfavourable forex movements. At constant currency, profits would have increased by £15M. Seats flown grew by 8.5% but total revenue per seat fell by 0.4% to £58.23, or by 4.5 at constant currency. Headline profit per seat decreased by 23.8% to £4.71. The average load factor increased by one percentage point to 92.6%

Revenue per seat was down 4.5% but was broadly flat at constant currency driven by high levels of market capacity growth due to the low fuel price environment, and an aggressive pricing environment that saw new ticket revenue per seat fall by 7.8% at constant currency, offset by ancillary revenue growth of 17.8% as high load factors and consumer-focused initiatives helped to offset pricing pricing pressures. Non-seat revenue increased by 9.3% supported by strong inflight sales of the enhanced product offering.

Within ancillary revenue the group has seen excellent early results from new initiatives in their baggage strategy as well as continued strong pick-up in allocated seating. In September they launched their WorldWide platform, leveraging their network and schedule in Europe’s main airports, offering connections with long haul partners as well as a channel for third party partner sales. The group also has opportunities to build on their partnerships with Europcar and Booking.com and is exploring other value channels with a number of projects in the pipeline over the next year.
In May they launched their hands free bag proposition which has sold over 420,000 bags. further products such as pre-order meals, entertainment and car parking will be integrated over the course of 2018.

Headline cost per seat increased by 2.4% to £53.52 driven by an adverse headline forex impact of £3.56 per seat and the costs of disruption, which remains a major industry challenge. At constant currency, the headline cost per seat decreased by 4.4% as the group continued to benefit from its hedged fuel position. Fuel costs reduced by 19.2% per seat, lean initiatives also helped reduce costs along with the up-gauging off the fleet with the delivery of an additional 21 A320 and two A320neo aircraft.

This helped offset a continued increase in the combined impact on cost from disruption of EU261 claims and an increasingly congested European aviation infrastructure; investments in resiliance including an additional light aircraft in Milan Malpensa, additional spare parts distributed across the network and three wet leased aircraft to add flexibility to the schedule; and inflationary cost increases such as agreed crew deals and start-up costs relating to the introduction of a new ground handling company, DHL, at Gatwick. The group remains on track to deliver flat headline cost per seat excluding fuel at constant currency from 2015 to 2019, excluding Air Berlin.

During the year the group took the decision to close its base in Hamburg in March 2018 with greater returns available by redeploying those aircraft elsewhere. They have grown market share in the UK, Switzerland and Italy. Growth in market share was more robust in France and the opening of a new base in Bordeaux will create the sixth base in the country.

In the UK the group increased its capacity by 8% with significant growth targeted at maintaining their share of the London market through Luton and Gatwick, and increasing capacity at Edinburgh, Bristol and Manchester. In France they increased their capacity by 11%, significantly ahead of the overall market, to consolidate their presence in Paris and increase their share in the regions.

The group increased capacity in Italy by 7%, further increasing investment in Venice, Naples and consolidating their position in Milan Malpensa. In Switzerland they increased capacity by 11%, increasing share inn both Geneva and Basel against overall market growth of 8%. In Germany, the group has decided to close one of its two bases in Hamburg, to focus on Berlin where they invested in maintaining their strong market position. The transaction with Air Berlin will secure a leading position in the city.

In the Netherlands the group increased capacity by 8% as they began to annualise the high growth from the previous two years, focusing on adding frequencies to existing destinations and capturing first wave demand from business passengers. They increased their capacity in Portugal by 14% as they continued to establish their position in both Lisbon and Porto. In Spain, in March they opened their first seasonal base in Palma Mallorca which has been a major success which has the potential to be replicated elsewhere. Overall they increased their capacity in Spain by 13% as they continued to build their presence at both Palma and Barcelona.

During the year, cancellations and delays decreased by 4% but on time performance decreased by one percentage point to 76%. The challenges of working at Gatwick, where the group outperforms most of their competitors, continue to have an impact on the rest of the network. The group was affected by severe weather at peak times of the year, strikes around the network including French ATC, Italian and Berlin ground handling; reduced capacity as French ATC performed systems upgrades in Bordeaux; and capacity limitation events at Gatwick such as disruption caused by a burst tyre on an Air Canada flight in July.

The group are undertaking a number of initiatives to attempt to improve their on-time performance. They have set up a second light aircraft at Milan to ensure engineers can fix aircraft more quickly, saving £6M in the summer and spare parts have been distributed around the network more quickly; they have consolidated Gatwick into the North terminal; they have improved customer communications and introduced further automation to the compensation claims process; they have introduced breaks to their schedule and increased block times to ensure the delivery of a more robust schedule, with three additional aircraft being wet leased as cover; and have employed new technology.

Following the upgrades at North Terminal at Gatwick, queue times at manual bag drops have declined with 90% of customers waiting less than five minutes. The terminal now processes 600 passengers per lane per hour compared to 170 last year which has seen customer satisfaction increase. The Autobag drop has now been rolled out to six further airports. Looking ahead the next phase will focus on the boarding process, using facial recognition technology to reduce queueing time and improve the efficiency of turn arounds. Trials of these new innovations will start in Gatwick and Luton in 2018.

There were a number of non-headline items in the year. There was a sale and leaseback charge of £16M relating to the sale and leaseback of the group’s ten oldest A319 aircraft. There was a £10M loss on disposal and a £6M maintenance provision catch-up upon entering the lease. The implementation of an organisational review has resulted in costs of £6M which involves redundancy costs and associated third party adviser fees. It is expected that a further £3M will be incurred in 2018 in the final phase. These changes are expected to realise annual savings of £15M.

Following the Brexit vote, the group is in the process of setting up a European AOC based in Austria. This helps secure flying rights for parts of the network which remain wholly between EU member states. This year the cost was £2M relating to set up costs. Following the award of their AOC and operating license in Austria the European airline will be operating with more than ten aircraft by the end of 2017 and is in the process of registering more aircraft over the next year. A resolution will be proposed at the AGM to update the group’s Articles of Association relating to shareholder ownership controls to ensure compliance with EU ownership requirements.

The group is contractually committed to the acquisition of 143 Airbus A320 family aircraft with a total list price of $14BN for delivery up to 2022. Capital expenditure is predicted to nearly double inn 2018 to £1.2BN with the spend predicted to be £900M in 2019 and £1BN on 2020. In the first half of next year, 82% of the fuel requirement is hedged at $512 per tonne with 75% hedged at $514 per tonne for the full year and 45% hedged at $533 per tonne in 2019. During this year the average market jet fuel price increased from $415 per tonne to $501 per tonne.

After the year-end the group signed an agreement with Air Berlin’s administrators, as part of which they will enter into leases for up to 25 A320 aircraft at Berlin Tegel, offer employment to former Air Berlin flying crews and take over other assets including slots for a purchase consideration of €40M with completion expected to close in December 2017. Based on current assumptions, the group expects to incur headline losses of around £60M on their activities at Tegel in 2018 using wet lease aircraft with initially lower loads and yields. In addition, one-off costs associated with the transaction are expected to be around £100M in 2018 representing the parallel ramp up of a dry lease operation, including fleet conversion and staff recruitment and training costs as well as transaction costs. The acquisition is expected to be earnings accretive by 2019.

They also completed the sale and leaseback of ten A319 aircraft in the year. Cash proceeds were $137M but due to the age of the aircraft and the maintenance provision accounting policies, a one-off charge of £20M was recognised in the year. The next tranche of ten has now also completed which will result in another non-headline charge of £20M in 2018.

Going forward the group plans to grow capacity by around 6% next year, excluding Air Berlin. Forward bookings are ahead of last year at 88% for Q1 and 26% for Q2. Revenue trends in Q1 have been encouraging, primarily as a result of some capacity leaving the market. Revenue per seat growth at constant currency in Q1 is now expected to be positive by low to mid-single digits and reflects a degree of short term benefit as well as an underling improvement. Revenue per seat in H1 is also expected to be positive by low to mid-single digits reflecting the move of Easter from Q3 but visibility for the second half is very limited.

Total headline cost per seat is expected to decrease by around 2% next year, excluding the impact of Air Berlin costs. Headline cost per seat excluding fuel and at constant currency is expected to increase by up to 1% due to underling crew and ground handling cost inflation. The total expected forex impact for next year is expected to be a headwind of around £5M but headline profit is expected to grow in the year.

At the current share price the shares are trading on a PE ratio of 20.6 which falls to 12.6 on next year’s consensus forecast. After a 24% decrease in the total dividend, the shares are yielding 2.6% which rises to 3.1% on next year’s forecast. At the year-end the group had a net cash position of £357M compared to £213M at the end of last year. After adjusting for the impact of operating leases adjusted net debt decreased by £11M to £413M.
On the 16th October the group submitted an expression of interest in certain assets of a restructured Alitalia.

On the 10th November the group announced the appointment of Johan Lundgren as CEO. He has spent the last year with TUI where he was group deputy CEO.
On the 15th December the group announced that it has acquired part of Air Berlin’s operations at Berlin Tegel airport. The acquisition will result in the group operating 25 aircraft from the airport and includes them leasing former Air Berlin aircraft, taking over other assets including slots and offering employment to former Air Berlin flying crew.

On the 23rd January the group released a trading update covering Q1. They delivered a strong start to the year with a significant growth in revenue in part driven by an increase in passengers flown and strong growth in inflight and ancillary sales. They have generated £28M in savings in the quarter and completed their acquisition of part of Air Berlin’s operations in Berlin.

Total revenue grew by 14.4% reflecting an increase of 1.4 million passengers, a 6.6% increase in revenue per seat, a strong increase in ancillary revenue and a benefit from forex movements. The increase in passengers was driven by a 5.5% increase in capacity and a 2.1 percentage point growth in load factors. Aiding these results has been recent capacity reductions brought about by the bankruptcies of Monarch, Air Berlin and Alitalia as well as the impact from Ryanair’s flight cancellations.

Ancillary revenue performed well. The momentum from last year’s product and pricing initiatives, particularly for bags and allocated seating, is continuing into this year and it is benefiting from both higher loads and further product offerings brought to the market.

Headline cost per seat, including fuel, improved by 1.6% due to low fuel prices and an ongoing focus on cost control. Excluding duel, cost per seat at constant currency increased by 1% as underlying unit cost improvements were offset by underlying inflation and the impact of disruption, mainly due to severe weather and industrial action. The group experienced 1,051 cancellations compared to 512 in Q1 last year with the biggest number due to adverse weather conditions in December.

The group completed the acquisition of part of Air Berlin’s operations at Berlin Tegel airport in December and started its flying programme in January, operating a reduced winter schedule with a fleet of mainly wet lease aircraft. The group currently expects the headline loss from the 2018 flying operation to be around £60M. The transition process for the main part of the operations is also progressing well. Leases on Air Berlin aircraft have been secured and the registration and conversion process has begun. The first ex-Air Berlin crew has now completed training and there is a strong recruitment pipeline over the next few months. The expected non-headline financial cost is expected to be around £100M.

Other non-headline costs included a charge of £19M relating to the sale and leaseback of ten A319 aircraft, costs of £1M associated with the group’s Brexit plans, and £1M of reorganisation costs.

Going forward the group’s seat capacity excluding Tegel is planned to grow in H1 by around 5%. Revenue per seat in Q2 is expected to increase by mid to high single digits which reflects a good underlying revenue performance, lower market capacity growth and the timing of Easter, which will have a negative impact in Q3. Headline cost per seat excluding fuel at constant currency is expected to increase by around 1% for the full year.

It is estimated that at current exchange and with jet fuel remaining within a $620 to $680 per tonne range, the group’s fuel bill in the first half is likely to decrease by between £60M and £65M and exchange rate impacts are expected to have around a £5M positive impact for the full year.

Overall last year was a pretty mixed one for the group. Profits declined, mostly due to unfavourable forex movements, but also due to intense competition driving down the revenue per seat. Net assets grew, however, as did the operating cash flow, with plenty of free cash being generated. The current year has started strongly, with a reversal of the forex pressures and several competitors entering administration. With a continued benign fuel price environment and a forward PE of 12.6 and yield of 3.1% these look decent value to me.